Archive for February, 2007

King’s Landing Goes Green

Friday, February 16th, 2007

Other

Download Document

Trade centre cost soars

Friday, February 16th, 2007

Convention facility expansion price jumps 40% to $800 million

Jeff Lee
Sun

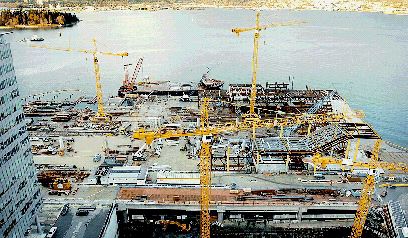
Work on the Vancouver Convention Centre expansion downtown is over budget and off schedule. Photograph by : Stuart Davis, Vancouver Sun

Runaway construction costs are being blamed for driving the price of the Vancouver Convention Centre expansion to $800 million, more than 40 per cent over its original budget.

The province acknowledged Thursday the project is behind schedule and it is impossible to keep it at its already-inflated budget of $615 million.

When the project was first announced in 2003, the price tag was cited as $565 million. In 2005, the province added $50 million because of construction cost increases. Now the Crown agency in charge of the project says it needs another $185 million.

The new overruns mean the project will cost B.C. taxpayers nearly twice as much as originally thought, pushing the provincial contribution to more than $417 million. The rest is being provided by the federal government, Tourism Vancouver and development revenues.

Ken Dobell, the chairman of the Vancouver Convention Centre Expansion Project, said the new estimates will be released in next Tuesday’s provincial budget.

He blamed the latest increase on a combination of rising construction costs and complicated technical factors.

They included difficult soil into which the 1,500 pilings that will support the centre have been pounded.

Those problems have also put the massive project behind schedule. Originally expected to be finished by November 2008, the centre, which at 9.2 hectares is physically one of the largest buildings of its kind in Canada, won’t be ready until March 2009.

Dobell said that still leaves plenty of time for the centre to be converted into the broadcast centre for the Vancouver 2010 Winter Olympics.

In an exclusive interview with The Vancouver Sun, Dobell said the Crown agency had no choice but to ask for more money, especially after the federal government turned down two requests last year to contribute more than the $222.5 million it has offered.

He said his board had already cut more than $42 million in “value engineering,” and projects it will get $40 million more in development and parking revenues when the centre is operating. But he said it is still being pushed around by a strong construction market that has plagued the entire province.

“We’re a victim of this damn government’s success,” he said. “They turned the economy around, the flaming construction is booming and you can’t hire a worker from here to Newfoundland.”

He acknowledged the new estimate may damage the government’s credibility, especially after then-tourism minister Olga Ilich said in late 2005 she was confident “we won’t be seeing any further increases.” She made the statement after the province boosted its share by another $50 million to $272.5 million.

“On the face of it, it is a problem. You can’t say it isn’t,” Dobell said of the potential for public backlash. “But you have to keep something in perspective. We started on this at a time when inflation in the construction industry was two per cent a year. And in fact inflation has been 10-12 per cent a year.”

Stan Hagen, who took over from Ilich as minister, said he was disappointed over the ballooning costs but wouldn’t fire anyone for miscalculating. “It would really be nice to have someone to blame for this, but I can’t,” he said. “This is one of those cases where there is some very unusual escalation of costs that were beyond our control.”

Hagen said he didn’t know until last week how badly the budget was out of line.

“In August, after I became minister I took over this file. I wanted to tie the number down, but we couldn’t. After a series of meetings over these numbers, we were still bouncing around all over the place.”

Dobell said his board has asked the auditor-general to review its operations again in light of the new budget to see if it used proper governance, project management methodology and procurement processes to keep the escalation of prices and costs under control.

It is also moving to lock in the costs as much as possible now by converting its project management contract with PCL Constructors Westcoast Inc. to a fixed-price contract next week.

Hagen said he expects the $800 million figure to be “at the outside” of what the convention centre will actually cost. The figure includes a contingency fund but he wouldn’t say how much because it’s part of the negotiations with PCL next week.

“I will be confident when I see the number they are going to sign on,” he said. “I expect it should come in at something less than the $800 million in the budget.”

Dobell said PCL acted as the Crown agency’s construction manager for all of the sub-trades working on the site, but will take over under a fixed budget.

© The Vancouver Sun 2007

January housing starts plunge 14.3% from December

Friday, February 16th, 2007

Christine Dugas
USA Today

WASHINGTON (Reuters) — The pace of U.S. home construction fell 14.3% in January, sharpest drop since October and much worse than economists had expected, a government report on Friday showed.

The drop followed two months of increases.

The Commerce Department said housing starts clocked an annual pace of 1.408 million units in January compared with a 1.643 million pace in December. January’s pace was the lowest in nearly 10 years.

Economists had forecast January housing starts to fall to a 1.60 million pace from December’s originally reported 1.642 million units annual rate.

Building permits, which offer a clue to future construction plans, fell 2.8% to a 1.568 million unit pace. Economists were expecting permits to register a 1.593 million pace, down from the revised 1.613 million pace of December.

Despite the gloomy data, a survey of builders’ confidence this week showed an uptick for February.

A private survey of home builders’ sentiment rose in February to its highest level since June 2006. The National Association of Home builders/Wells Fargo Housing Market Index jumped to 40 in February from 35 the previous month. Economists had predicted the index to remain unchanged. Readings below 50 indicate more builders view market conditions as poor rather than favorable.

Realtors expect home price recovery


By Christine Dugas, USA TODAY

Home prices are likely to spring back in the coming months, the National Association of Realtors predicted Thursday after reporting that median prices fell in 73 metro areas in the final three months of 2006.

Last year “was the year of contraction,” said David Lereah, the NAR’s chief economist. “When we get the figures for this spring, I expect to see a discernible improvement in both sales and prices.”

Even in an overall sluggish fourth quarter, 71 areas had price gains, the NAR said. And 14 of those areas saw double-digit year-over-year percentage gains.

“At least the bottom appears to have already occurred,” says Lawrence Yun, an NAR economist. “It looks like the figures will be improving. Whether or not that will be sustainable is a different question.”

Nationwide, the median sales price for an existing single-family home fell to $219,300 in the fourth quarter, down 2.7% from the same period in 2005.

Several once-sizzling markets in Florida continued to see price declines. The Sarasota-Bradenton-Venice area was worst hit; prices fell 18% in the fourth quarter.

Still, the NAR pointed out that despite the recent downturn in prices, gains for typical single-family homes the past five years have been robust in many metro areas — and explosive in others. In Riverside-San Bernardino-Ontario, Calif., for example, prices have soared 155.3% in the past five years.

Other parts of California have yet to benefit. In the inland areas, many builders who are struggling to move new-home inventory have caused prices to fall sharply, says Leslie Appleton-Young, chief economist of the California Association of Realtors.

Such price drops, though, are starting to lure buyers, a trend that could help lift the overall housing market. “Buyers are responding to seller pricing and incentives, and there’s pent-up demand as a result of buyer hesitation in the second half of 2006,” says Pat Vredevoogd Combs, the NAR’s president.

Among the areas that reported the biggest gains at the end of last year was Atlantic City, which saw a 25.9% jump in home prices in the fourth quarter, compared with the same period in 2005. And Trenton-Ewing, N.J., enjoyed an 18.9% rise in prices. It could post even better results this year.

“Interest rates remain extremely reasonable, and the buyers are out there and they’re buying; they’re not just shopping,” says Rosalie Daniels, broker-owner of RE/Max TriCounty in Hamilton Township, on the outskirts of Trenton. Written contracts for home sales in January 2007, Daniels says, are 35% ahead of the pace of January 2006.

Low mortgage rates should also help boost sales. The average 30-year fixed rate for 2006 was 6.40%; it’s now 6.30%, Freddie Mac said Thursday.

Median home prices in 149 metro areas


Metropolitan Area

Price in thousands


2005 Q4

2006 Q4

Change

Akron, OH

117.8

110.2

-6.5%

Albany-Schenectady-Troy, NY

190.8

198.7

4.1%

Albuquerque, NM

174.1

187.5

7.7%

Allentown-Bethlehem-Easton, PA-NJ

245.7

249.7

1.6%

Amarillo, TX

105.4

108.3

2.8%

Anaheim-Santa Ana, CA (Orange Co.)

699.8

690.7

-1.3%

Appleton, WI

129.3

128.4

-0.7%

Atlanta-Sandy Springs-Marietta, GA

170.2

166.8

-2.0%

Atlantic City, NJ

269.9

339.8

25.9%

Austin-Round Rock, TX

167.0

175.2

4.9%

Baltimore-Towson, MD

265.1

277.9

4.8%

Barnstable Town, MA

405.2

373.5

-7.8%

Baton Rouge, LA

153.8

173.4

12.7%

Beaumont-Port Arthur, TX

104.3

120.0

15.1%

Binghamton, NY

95.8

95.8

Unch

Birmingham-Hoover, AL

160.8

161.7

0.6%

Bismark, ND

129.1

127.4

-1.3%

Bloomington-Normal, IL

161.5

151.3

-6.3%

Boise City-Nampa, ID

N/A

209.5

N/A

Boston-Cambridge-Quincy, MA-NH

397.5

388.0

-2.4%

Boulder, CO

349.5

363.1

3.9%

Bridgeport-Stamford-Norwalk, CT

468.5

445.7

-4.9%

Buffalo-Niagara Falls, NY

99.8

96.6

-3.2%

Canton-Massillon, OH

106.1

106.2

0.1%

Cape Coral-Fort Myers, FL

293.1

258.9

-11.7%

Cedar Rapids, IA

133.8

129.2

-3.4%

Champaign-Urbana, IL

142.6

141.6

-0.7%

Charleston-North Charleston, SC

198.4

210.9

6.3%

Charleston, WV

117.3

114.3

-2.6%

Charlotte-Gastonia-Concord, NC-SC

183.5

198.2

8.0%

Chattanooga, TN-GA

132.6

134.6

1.5%

Chicago-Naperville-Joliet, IL

265.6

268.1

0.9%

Cincinnati-Middletown, OH-KY-IN

143.7

138.7

-3.5%

Cleveland-Elyria-Mentor, OH

135.7

130.9

-3.5%

Colordo Springs, CO

209.2

219.4

4.9%

Columbia, SC

136.5

N/A

N/A

Columbus, OH

147.9

138.7

-6.2%

Corpus Christi, TX

131.2

129.7

-1.1%

Cumberland, MD-WV

85.7

98.0

14.4%

Dallas-Fort Worth-Arlington, TX

150.2

144.3

-3.9%

Danville, IL

63.8

N/A

N/A

Davenport-Moline-Rock Island, IA-IL

109.2

116.4

6.6%

Dayton, OH

112.8

119.5

5.9%

Decatur, IL

84.5

89.2

5.6%

Deltona-Daytona Beach-Ormond Beach, FL

208.9

198.6

-4.9%

Denver-Aurora, CO

247.5

245.6

-0.8%

Des Moines, IA

147.2

144.5

-1.8%

Detroit-Warren-Livonia, MI

156.2

154.6

-1.0%

Dover, DE

185.7

200.5

8.0%

Durham, NC

168.7

168.6

-0.1%

Elmira, NY

78.8

78.4

-0.5%

El Paso, TX

118.4

131.8

11.3%

Erie, PA

99.7

102.6

2.9%

Eugene-Springfield, OR

209.0

230.9

10.5%

Fargo, ND-MN

134.6

136.6

1.5%

Farmington, NM

160.5

183.0

14.0%

Ft. Wayne, IN

104.1

101.6

-2.4%

Gainesville, FL

197.7

211.5

7.0%

Gary-Hammond, IN

128.4

123.2

-4.0%

Glens Falls, NY

170.5

174.4

2.3%

Grand Rapids, MI

135.1

129.5

-4.1%

Green Bay, WI

150.1

145.6

-3.0%

Greensboro-High Point, NC

150.0

150.2

0.1%

Greenville, SC

152.2

150.0

-1.4%

Gulfport-Biloxi, MS

147.0

152.0

3.4%

Hagerstown-Martinsburg, MD-WV

222.1

213.9

-3.7%

Hartford-West Hartford-East Hartford, CT

253.8

253.9

0.0%

Honolulu, HI

620.0

620.0

Unch

Houston-Baytown-Sugar Land, TX

146.3

148.6

1.6%

Indianapolis, IN

122.0

117.1

-4.0%

Jackson, MS

142.5

145.3

2.0%

Jacksonville, FL

182.2

180.4

-1.0%

Kalamazoo-Portage, MI

N/A

N/A

N/A

Kankakee-Bradley, IL

123.6

125.7

1.7%

Kansas City, MO-KS

156.5

153.1

-2.2%

Kennewick-Richland-Pasco, WA

157.7

151.2

-4.1%

Kingston, NY

260.0

243.2

-6.5%

Knoxville, TN

148.8

153.6

3.2%

Lansing-E.Lansing, MI

139.1

135.0

-2.9%

Las Vegas-Paradise, NV

315.9

313.5

-0.8%

Lexington-Fayette,KY

150.7

146.3

-2.9%

Lincoln, NE

N/A

137.7

N/A

Little Rock-N. Little Rock, AR

125.9

125.9

Unch

Los Angeles-Long Beach-Santa Ana, CA

568.4

586.5

3.2%

Louisville, KY-IN

134.6

137.6

2.2%

Madison, WI

224.6

225.4

0.4%

Memphis, TN-MS-AR

144.2

141.9

-1.6%

Miami-Fort Lauderdale-Miami Beach, FL

391.2

366.8

-6.2%

Milwaukee-Waukesha-West Allis, WI

214.9

210.9

-1.9%

Minneapolis-St. Paul-Bloomington, MN-WI

230.5

228.3

-1.0%

Mobile, AL

133.7

137.2

2.6%

Montgomery, AL

136.3

139.6

2.4%

Nashville-Davidson–Murfreesboro, TN

170.9

N/A

N/A

New Haven-Milford, CT

279.7

278.8

-0.3%

New Orleans-Metairie-Kenner, LA

178.7

162.1

-9.3%

New York-Northern New Jersey-Long Island, NY-NJ-PA

454.1

464.4

2.3%

New York-Wayne-White Plains, NY-NJ

518.1

498.4

-3.8%

NY: Edison, NJ

383.0

366.9

-4.2%

NY: Nassau-Suffolk, NY

472.4

473.7

0.3%

NY: Newark-Union, NJ-PA

413.9

426.6

3.1%

Norwich-New London, CT

262.1

257.9

-1.6%

Ocala, FL

161.1

170.7

6.0%

Oklahoma City, OK

115.5

123.7

7.1%

Omaha, NE-IA

137.7

136.2

-1.1%

Orlando, FL

261.8

272.1

3.9%

Palm Bay-Melbourne-Titusville, FL

209.5

173.9

-17.0%

Pensacola-Ferry Pass-Brent, FL

168.2

161.4

-4.0%

Peoria, IL

112.7

108.9

-3.4%

Philadelphia-Camden-Wilmington, PA-NJ-DE-MD

215.1

222.3

3.3%

Phoenix-Mesa-Scottsdale, AZ

268.4

262.2

-2.3%

Pittsburgh, PA

114.3

112.2

-1.8%

Pittsfield, MA

210.7

220.6

4.7%

Portland-South Portland-Biddeford, ME

245.7

245.2

-0.2%

Portland-Vancouver-Beaverton, OR-WA

256.6

285.4

11.2%

Providence-New Bedford-Fall River, RI-MA

294.4

291.3

-1.1%

Raleigh-Cary, NC

197.7

226.3

14.5%

Reading, PA

143.2

143.2

Unch

Reno-Sparks, NV

365.5

332.9

-8.9%

Richmond, VA

210.3

229.4

9.1%

Riverside-San Bernardino-Ontario, CA

389.9

406.4

4.2%

Rochester, NY

112.8

111.4

-1.2%

Rockford, IL

114.9

121.5

5.7%

Sacramento–Arden-Arcade–Roseville, CA

380.9

365.1

-4.1%

Saginaw-Saginaw Township North, MI

N/A

N/A

N/A

Saint Louis, MO-IL

138.8

139.5

0.5%

Salem, OR

194.1

223.1

14.9%

Salt Lake City, UT

182.3

223.6

22.7%

San Antonio, TX

137.8

140.6

2.0%

San Diego-Carlsbad-San Marcos, CA

607.4

579.8

-4.5%

San Francisco-Oakland-Fremont, CA

718.7

733.4

2.0%

San Jose-Sunnyvale-Santa Clara, CA

740.0

760.0

2.7%

Sarasota-Bradenton-Venice, FL

367.4

301.3

-18.0%

Seattle-Tacoma-Bellevue, WA

335.0

372.9

11.3%

Shreveport-Bossier City, LA

125.6

131.7

4.9%

Sioux Falls, SD

136.4

133.7

-2.0%

South Bend-Mishawaka, IN

89.9

89.8

-0.1%

Spartanburg, SC

125.6

121.3

-3.4%

Spokane, WA

168.6

189.2

12.2%

Springfield, IL

105.9

94.9

-10.4%

Springfield, MA

198.6

199.4

0.4%

Springfield, MO

120.8

119.4

-1.2%

Syracuse, NY

112.7

115.4

2.4%

Tallahassee, FL

176.4

185.3

5.0%

Tampa-St.Petersburg-Clearwater, FL

223.0

229.7

3.0%

Toledo, OH

112.7

104.8

-7.0%

Topeka, KS

105.2

101.1

-3.9%

Trenton-Ewing, NJ

243.1

289.0

18.9%

Tucson, AZ

246.2

239.4

-2.8%

Tulsa, OK

120.0

128.5

7.1%

Virginia Beach-Norfolk-Newport News, VA-NC

220.5

235.2

6.7%

Washington-Arlington-Alexandria, DC-VA-MD-WV

432.9

421.6

-2.6%

Waterloo/Cedar Falls, IA

106.3

102.9

-3.2%

Wichita, KS

108.7

113.4

4.3%

Worcester, MA

289.5

274.7

-5.1%

Yakima, WA

135.2

144.6

7.0%

Youngstown-Warren-Boardman, OH-PA

86.7

80.0

-7.7%

U.S.

225.3

219.3

-2.7%

Northeast

281.7

274.6

-2.5%

Midwest

168.9

161.8

-4.2%

South

188.7

181.7

-3.7%

West

353.6

355.1

0.4%

NA=not available
Source: National Association of Realtors

Changing password thwarts phishers

Friday, February 16th, 2007

Peter Wilson
Sun

Never bothered to change the default password that came with the router for your home computer network?

You’re not alone. A study by Indiana University shows that about 50 per cent of us don’t bother or don’t know how.

And that means that 50 per cent of us are open to having our personal financial information stolen by what is known as — in yet another Net catch phrase — drive-by phishing.

You can become a victim — and chances are you’ll never know it’s happened — if you end up on a malicious website that downloads a JavaScript to your computer.

That JavaScript gets into your router settings by using the manufacturer’s default password. Then it changes the settings and, bam, it’s as if you have a phony directory of websites installed on your computer.

From now on when you type in www.mybank.com, for instance, you’ll be directed to a server operated by the bad guys where they’ve set up any number of fake financial websites. Once there, you type in your login and your password and instantly the evildoers have access to your account.

“The thing is they’re attacking the router, not the PC, so any security software you have installed to check that everything is okay will not really tell you that something bad is happening,” said Zulifar Ramzan, senior principal researcher at security firm Symantec, and one of the scientists who discovered the problem.

And it’s likely, adds Ramzan, who worked with colleagues at Indiana University, that you won’t even know to check for the problem.

“This particular class of attack is really silent. It doesn’t try to make itself known.”

To protect yourself, all you have to do is change your router password.

Ramzan said it’s understandable why half of users don’t bother to change their router default password. You have to read the manual to figure out how to do it and many router installation programs never prompt you.

“For the past few weeks I’ve been playing with a lot of different routers and trying the attack out on them,” said Ramzan. “So I put the [installation] CD in my computer and follow the steps. And what I find is that a lot of the router manufacturers do not include a prompt for changing the password.”

Ramzan said his speculation is that the manufacturers do this to make installation convenient, but it puts users in danger.

© The Vancouver Sun 2007


There’s more to buying a condo than you may think

Friday, February 16th, 2007

Jane Taguicana
Sun

TORONTO — To mow or not to mow.

For prospective home buyers, that is a question.

While many people say it all boils down to lifestyle choice, there’s more to consider when you opt to buy a condominium instead of a house.

For the most part, experts say soon-to-be unit owners should consider condo fees.

“When you buy a condo, you’re actually buying a little piece of the condo corporation,” explains Trish Hart, a specialist at mortgage brokerage Invis.

“You don’t own a title to land. You own a piece of the pie.”

To maintain common areas such as the roof, walkways and landscaping, co-owners pay a condo fee. Amenities such as a fitness facility, swimming pool and party room can add to this fee.

This charge affects the purchaser’s budget from the start of the buying process until the end of ownership.

For starters, half of the condo fee is included in the debt calculation required by a bank when you apply for a mortgage.

“That’s something I didn’t have to do in a single-family home,” Hart said.

The expense calculation for a single-family home includes property taxes, utilities and interest. If you choose a condo, the fee will be added to the expenses that drive down the amount the bank will lend.

For example, if the buyer’s annual income is $52,000, the typical approved mortgage for a condo unit is $190,000.

If the same buyer went for a single house, the approvable mortgage could be upped by 10 grand to $200,000.

It’s all due to the condominium fee.

Experts are quick to add that even though it might seem to be a drawback, the fixed cost for condo maintenance can help your budgeting in the long run, acting in effect as a forced savings plan.

“With homes, you don’t think too much about the future — you don’t think, ‘I’m gonna put away $10,000 for my roof repair 10 years from now,'” said Denise Lash, host of the new reality TV show The MondoCondo.

“With condos, the law is you have to put money away every month for future repairs. You don’t have any surprises. It enables you to budget,” Lash said.

Hart added that the no-surprises nature of the condo fee — barring some major unexpected problem with the building that requires an extra levy — allows you to have a better idea what your actual cost is every month to run the property.

Lash also noted that the availability of amenities can add to your savings. “In a way, you are saving because you have a fitness club, a concierge and a party room,” she said.

“You have the advantages that when you live in a home you may pay extra for.”

The future condo owner should also consider restrictions on borrowing.

“Banks have certain restrictions on the type of condo they will finance. I have banks that won’t look at an apartment condo that’s less than 600 square feet,” Hart said.

“It’s not the type of market [banks] want to get in.”

You also have to be prepared for more paperwork.

Banks require a reserve fund study to determine whether the condo corporation is financially viable.

“[Banks] want to know whether the condo corp has enough money set aside to replace the carpet in the next three years,” Hart said.

© The Vancouver Sun 2007


Reaction mixed to debut of alleged quantum computer

Friday, February 16th, 2007

Some websites question Burnaby-based company’s claims

Peter Wilson
Sun

The Net-based buzz around Burnaby-based D-Wave Systems Inc. quantum computing demonstrations in Silicon Valley on Tuesday and at Vancouver’s Science World on Thursday has been mixed.

Some sites simply parroted the D-Wave press release saying its video hookup from a lab in Burnaby was indeed the first demonstration of a commercial quality quantum computer.

Others, relying mainly on an Associated Press report following the California launch, were more doubtful, and quoted HP quantum computer architect Phil Kuekes as saying: “Until we see more actual measurements, it’s hard to know whether it succeeded or not.”

Some critics complained the research hadn’t been subjected to peer review.

The company says it will have a 32-qubit system by the end of this year. It hopes corporate customers will be able to rent time on the quantum computer in the first quarter of 2008. That will be followed, D-Wave hopes, by a 512-qubit system, and then, at the end of 2008, by a 1,024-qubit system.

A qubit is the smallest unit of information in quantum computing, which uses quantum mechanics for its operations. A qubit is exponentially larger than a bit used in traditional computers. Quantum computers promise the ability for a life-sciences company being able to run 50 billion possible scenarios for a new drug, and then picking out the one that works.

This week’s demonstration showed D-Wave’s 16-qubit device solving Sodoku puzzles, searching a database for molecules with similar structural elements to those in the drug Prilosec, and running a seating chart program that chose suitable dining partners for the likes of Genghis Khan and Cleopatra.

In an earlier interview, company founder Geordie Rose was asked whether anyone at the demonstrations could possibly know if there really was actual quantum computing going on, especially since the demo was being done over a video link.

“To be brutally honest, of course you don’t,” said Rose. “And it would be very difficult to show that, even if you had the machine right next to you.

“With this demo we’re not asking anybody for anything. What we’re doing is showing the system in the way that we’ve designed it to function, so that people who have an interest can come back and kick the tires.

“The demo isn’t designed to get under the hood. This is more of a high-level demonstration of capability.”

© The Vancouver Sun 2007


How did municipal taxes get so skewed?

Friday, February 16th, 2007

Every time a modest commercial block falls to a condo tower, the city budget suffers

Don Cayo
Sun

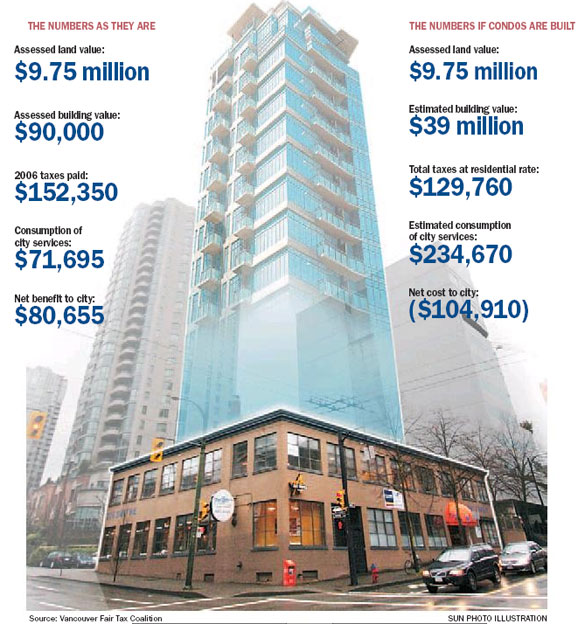
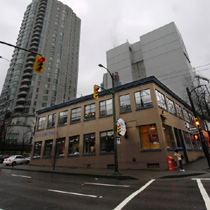
This two-storey Brodie Brush Building at 225 Smithe in downtown Vancouver generates $152,350 in annual tax revenues for the City of Vancouver, but uses just $71,695 in municipal services. If one were to imagine thatt it was replaced with a glitzy Yaletown residential tower, the city would lose $1,000 to $1,500 on every condo unit built. Photograph by : Glenn Baglo/Vancouver Sun

This year’s property tax bill for the old Brodie Brush Building at Cambie and Smithe will likely be twice as much as the building is worth — not counting its underlying land.

The bill will be split among four tenants. Last year, the portion paid by the largest of them, Art Works Gallery, exceeded $60,000. That’s more than three times what gallery owner Deanna Geisheimer paid in tax for the same space 10 years ago, and a lot more than her annual rent.

This year’s tax bills haven’t been sent out yet, but Geisheimer fears she’ll be clobbered again. The plain, two-storey former factory that houses her business squats amid a forest of glitzy glass condo towers, and this year the assessed value of the land shot up 50 per cent — a far bigger jump than ever before. It now stands at almost $10 million, or 110 times the building’s value.

Other businesses have been hit as hard by what many Vancouver business people see as an unrelenting assault from city hall. Since last summer, 42 businesses have folded or fled from the five-block Yaletown Heritage Area, and half the premises they used to occupy have no new tenant.

Yaletown is particularly hard-hit because of its astronomical land values, but the sting is being felt in every neighbourhood.

Over on Burrard, not far from the bridge, Henry von Tiesenhausen of Commercial Electronics notes that, in a five-year period when the tax on his home increased 16 per cent (and when his company’s sales were flat) his business taxes rose 102 per cent.

“I have to ask the question,” von Tiesenhausen said in a letter to Mayor Sam Sullivan, “is it worthwhile even operating a business in the City of Vancouver?”

A growing number seem to be asking the same thing — and answering in a way no one wants to hear. While commercial growth in the city has long trailed residential, the last two years have seen a disturbing new trend. For the first time, more businesses closed than opened.

All this says something is broken and needs to be fixed.

As I see it, it’s not just one problem, but three:

First, Vancouver’s success in building vibrant, high-density neighbourhoods has come with high hidden costs that nobody at city hall seems to have a handle on. The policies that drive the transformation from commerce to condos need to be rethought with an eye to how to stop losing money on every new tower.

Secondly, it is not fair that business property is assessed by one standard yet taxed according to another. This invites aberrations like the bizarre levy on the Brodie Building. The city justifies tax increases with the logic that at least the owner has an ever-more valuable asset, but this is not the case for business owners, who usually rent.

Thirdly, the total tax burden on businesses is way out of whack. They pay far more than the cost of the services they consume, while home-owners pay far less.

A soaring tax base

How does a prospering city — one experiencing not only an explosion in land values, but also a great deal of new construction that adds hugely to its tax base — get into such mess? It’s easy to see how a soaring real estate market might make it too costly for some businesses to hang on to the sites they occupy, but why do taxes go up so much faster than market-driven prices?

After all, every time a ho-hum commercial block falls to the wrecker’s ball and a condo tower rises from the rubble, the city’s tax base shoots up. A building worth a few tens of thousands is typically replaced by one worth tens of millions, enlarging the base for the city to tax.

It takes some head-scratching to understand it, but this kind of development — something that happens all the time — actually produces a brutal hit to the city budget. It results in your tax bill and mine inching up once again, while the city’s remaining business properties get clobbered.

In the last 15 years, Vancouver has added well over 40,000 new homes, mainly condos or townhouses. A great many of them were built where a business used to be. So the hits on your tax bill really add up.

Indeed, every new condo unit built in the city today will shift $1,000-$1,500 of annual costs to other taxpayers, according to the careful calculations of Paul Sullivan, a property tax specialist with Burgess Cawley Sullivan and Associates, and the technical co-chairman of the Vancouver Fair Tax Coalition.

Sullivan reckons that each new condo unit shifts 30-40 cents of extra tax to each of the city’s 153,000 homeowners, and 13 times that much — $4 or $5 — to each of the 14,000 commercial properties. (The average commercial assessment is just under $1.2 million, or not quite 21/2 times the average home.)

To understand why, look at the taxes on the Brodie Building, and what will happen if or when it is razed to make way for condos.

The land is already assessed at $10 million. This is considered to be “its best and highest use” — i.e., as if it were the site of a condo tower, not just a handful of modest businesses. Of course, the value of a new 100-unit condo tower would be about $39 million, or 400 times more than the $90,000 building that is there today.

Yet the city’s tax take from the redeveloped property would drop by about $22,000

How can this be? After all, the value of the new building plus the land adds up to nearly $50 million, or five times more than the land and the old building.

Well, the existing site is taxed at the business rate, which is six times higher than the residential rate. If you do the math, a six times higher rate on a $10 million property produces a tax bill of $152,000, while the residential rate applied to 100 units with a combined value of $49 million works out to just $130,000.

But the $22,000 loss of tax revenue is just a small part of how redeveloping the site would hit the city budget. The big impact is on the cost side of the ledger:

A formula that estimates how much demand various properties place on the city deems that the current occupants of the Brodie Building consume $72,000 worth of city services, while the occupants of 100 condos would consume $235,000 worth. Thus, Sullivan calculates, city revenue will drop by $22,000 — or 14.8 per cent of what it gets from the existing property — and its costs will rise by $213,000, or 227 per cent.

Higher and higher taxes

What happens when the city takes this kind of budgetary hit?

Well, it never seems to tighten its belt. It just ratchets up its tax bills.

The way it makes up the shortfall goes a long way to explain how Vancouver’s property tax system got to badly skewed.

Prior to 1983, back in the day when the B.C. government set property tax rates, the business rate in Vancouver was roughly 21/2 times the residential rate.

That was more or less what it should be. People calculate “fair” rates in various ways, but most agree that businesses should pay somewhat more, for several reasons. For one, municipal taxes give them a deduction for federal and provincial tax purposes, which means each $4 they pay actually costs them only $3. Also, consumption studies show they put more strain on city services per dollar of assessed value.

So if the city were to increase the tax load on business properties at a ratio of 2.5 to 1, commercial property owners wouldn’t have much to whine about. And that’s just what council did in 1984, the first year it got to set its own tax rates.

At the same time, council adopted a formula, which has changed only slightly, to divide the total tax bill 60-40 between businesses and residents.

What has happened since is that home-building has dramatically out-stripped business growth. This means that existing residents get lots of help from newcomers — these days about 6,000 a year — to pay their percentage of the total tax load. But there aren’t many new companies to help pay the extra tax load added to the business portion.

In token recognition of this, the city has tinkered with the percentages. The split is now down to 55 per cent paid by business, and 45 by residents. But this does not compensate for the imbalanced growth in a city where residential property values have soared seven-fold over 20 years, while the value of commercial properties has merely tripled.

Today, 83.2 per cent of the assessed value of all property in the city is residential, yet businesses still pay 55 per cent of the property taxes. To generate this much revenue, the general business tax rate has to be set six times higher than residential rates, and the rate for other categories higher still. Utilities pay 12 times more than residents, and the city’s 30 remaining major industries pay 10.2 times more.

The current council is the third in a row to commit itself to shifting one per cent of the total tax burden from businesses to residents each year. But there are three problems with this:

First, despite the promise, they don’t do it every year.

And even when they do, the impact is minimal. Gallery owner Geisheimer wryly notes that last year, when council lived up to its promise and made the shift for the first time in three years, her tax bill still went up $7,000.

And finally, Sullivan makes the case that the city is shooting at the wrong target. A 1996 study by KPMG found that businesses paid $2.07 for every $1 of city services they consumed, while residents paid just 57 cents. That means business paid 3.7 times more for services than residents paid.

KPMG assumed — a bit arbitrarily, I think — that a 3-to-1 ratio would be fair. To get there, it proposed the one-per-cent-a-year shift in tax burden that was adopted by subsequent councils and has been acted on sporadically.

Data published by the city shows slow movement toward the goal of a 3-to-1 ratio, until it finally was reached last year. The trouble is, Sullivan says, the assumption on which the data is based turns out to be far too low.

In 1996 when KPMG did its study, residents were consuming 71 per cent of city services and businesses 29 per cent. Today, after a decade of sharply imbalanced growth, there are more residents and fewer businesses. The result is that residents now consume 76 per cent of services and businesses just 24 per cent.

So, do the math and you find that businesses are now paying 4.7 times more than residents for the services they use. That’s a 27-per-cent heavier load than in 1996, when council acknowledged the system was unfair.

Makes taxes realistic

What should be done now?

Two measures are needed:

The first is to tie the tax split — the portion paid by businesses versus the portion paid by residents — to actual consumption.

The Fair Tax Coalition proposes that an outside party be hired to do consumption studies every two or three years, and that city tax bills be based on the findings. Thus, as the mix of residents and businesses continues to change, so would the tax split.

Businesses would still, no doubt, pay a much bigger share of the bill than their actual consumption would dictate. But the proportionate load carried by each business would remain constant, probably near the ratio of three-to-one proposed by KPMG a decade ago, and it would not creep upward to the unsustainable level it has reached today.

While this would ensure a fairer burden for the business community as a whole, it wouldn’t protect businesses like the Art Works Gallery from the vicious swings that happen when their location is coveted as prime residential land.

Basing each business’s taxes on the rent it pays, not on land value, would correct that. This would not mean that businesses, as a whole, would pay either more or less total tax. It would simply even the load so similar businesses would pay similar amounts, and it would protect against sudden wild swings. Yet it would also keep market forces in play and allow neighbourhood business districts to evolve organically. Upscale neighbourhoods would inevitably command higher rents, and thus the more desirable business locations would continue to pay more — as they should.

The province has already agreed to enact legislation this spring to base taxes for port-based businesses on their rent. It would be easy to extend the practice to all of Vancouver, and possibly to other cities if they face the same kinds of inequities.

Given the way lawyers and politicians work, however, this will take time. So city council should take two interim steps without delay:

First, it should get its spending under control. In inflation-adjusted dollars, the city’s tax take has shot up 57 per cent in the last 10 years. Even adjusted for population growth, the per-person tax take is up 21 per cent.

Council should cap this year’s business tax increases and keep it capped until a long-term, equitable solution is in place.

The council of the day approved such a tax cap back in the early 1990s, when it recognized the alternative was to see many firms die. The dismal vacancy figures in Yaletown today, the fact that the city has fewer businesses this year than last, and the urgent concerns voiced by business owners in every neighbourhood proclaim loud and clear that this grim prospect is at least as real today.

© The Vancouver Sun 2007


Condo project markets with ‘webisode’ promo

Thursday, February 15th, 2007

Warren Frey
Other

Download Document

David Currell will manage Loden 5 star Hotel being constructed at Melville & Bute

Thursday, February 15th, 2007

Five years after stickhandling Yaletown’s Opus, David Currell takes on a new project

Bruce Constantineau
Sun

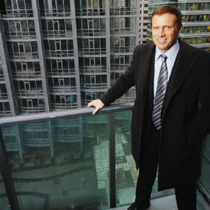
David Currell checks progress on the 15-storey, $35-million Loden Hotel (behind him) from the adjacent 43-storey, $10-million residential tower at Melville and Bute. The Loden will offer five-diamond services and amenities. Photograph by : Ian Lindsay, Vancouver Sun

The first new downtown Vancouver hotel in five years will open this summer under the stewardship of the same general manager who opened the last one.

David Currell has been named general manager of the Loden Hotel — a 130-room boutique property near Melville and Bute that will begin taking in guests in about six months.

In 2002, Currell was general manager of the Opus Hotel, stickhandling that hip property’s hectic opening in Yaletown.

“After the Opus, I thought I’d never open another new hotel again because it’s a lot of blood, sweat and tears,” he said in an interview Wednesday. “But there are amazing rewards that go along with it because you take something that doesn’t exist and bring a whole new business to life. It’s exciting.”

The Loden — so named because it means “deep olive green,” which connects to Vancouver’s natural surroundings — will be operated by California-based Kor Hotel Group.

It’s a 15-storey, $35-million project being developed by the Amacon Group of Vancouver, which is also building a 43-storey, $105-million residential tower with 237 units next door.

Currell, who has spent the past 21/2 years managing a 199-room boutique hotel in San Francisco, said he’s glad to be back home in a city that’s booming with so much development.

The former Pan Pacific Hotel director of operations said the Loden will offer a five-diamond level of services and amenities, and expects to be in direct competition with boutique hotels like Opus, Wedgewood and the Shangri-La, which is scheduled to open late next year at Georgia and Thurlow.

“I think the city needs more boutique hotels,” he said. “There’s definitely a place for us in this market.”

While the Opus has a reputation as a hip hotel, Currell expects the Loden will appeal to people looking for something different.

“I think we’ll appeal to a lot of guests who have outgrown that cool, hip, sexy hotel thing,” he said. “They’re looking for something a little bit more substantial as far as style, design and service goes.”

Kor Hotel Group representative Kimberli Partlow said the company specializes in smaller boutique hotel properties. It operates 10 hotels in the U.S and Mexico and the Loden will be its first Canadian hotel.

“We bring a progressive design and very personalized service,” she said. “We expect to bring service to another level in Vancouver.”

The Loden will have 119 guest rooms and 11 suites, and room rates will range from $399 for a 350-sq.-ft. room to $3,000 a night for a 1,600-sq.-ft., two-bedroom penthouse suite.

The hotel will also have 3,500 sq. ft. of meeting space and a 16-seat boardroom and Currell expects to appeal to a lot of business travellers looking to remove themselves slightly from the “concrete jungle” in the centre of the business district.

A hotel spa is expected to open by the end of this year, and all guest rooms will feature 42-inch flat-panel TVs, DVD players, MP3/iPod docking connectivity, high-speed wireless Internet access and cordless speaker phones.

Currell said a rooftop swimming pool, with a bar-bistro facility, will be one of the hotel’s signature amenities.

Vancouver hotel industry consultant Angus Wilkinson said the Loden will open during a strong business cycle in the downtown hotel market. He noted downtown hotels averaged nearly 75-per-cent occupancy last year and had average daily room rates of more than $152 — up two per cent and six per cent respectively.

“There’s also no Georgia Hotel for the next 21/2 years [because it is being renovated], so that takes 313 rooms out of the market,” Wilkinson said. “I think everyone will benefit from that.”

He said the two most popular boutique hotels in Vancouver — the Opus and the Wedgewood — enjoy high average room rates and occupancy levels of more than 80 per cent.

“There’s room for more of that kind of product in this market,” Wilkinson said.

After the Loden opens, the next new downtown hotel properties include the Shangri-La (with 119 rooms), the Fairmont Pacific Rim with 415 rooms set to open near the convention centre in late 2009 and restaurateur Umberto Menghi’s 40-room boutique hotel slated to open at 1380 Hornby in 2009.

© The Vancouver Sun 2007

Winter housing sales fall in 40 states compared with Q4 2005

Thursday, February 15th, 2007

USA Today

WASHINGTON (AP) — The slump in housing deepened in the final three months of last year with sales falling in 40 states and median home prices declining in nearly half of the metropolitan areas surveyed, a real estate trade group reported Thursday.

The National Association of Realtors report showed that the biggest declines were in former boom areas.

The biggest percentage decline occurred in Nevada, a drop of 36.1% in the sales pace in the final three months of 2006 compared with the same period in 2005.

In other former boom areas, Florida saw sales drop 30.8%, in Arizona sales were down 26.9% and they fell 21.3% in California.

The Realtors said that while sales declined in the fourth quarter in 40 states, six states showed increases and one state, Utah, had an unchanged sales pace. Three states did not report enough data to make comparisons.

Nationally, sales declined 10.1% in the fourth quarter of 2006 compared with the same period a year ago.

The median price of a new home, the midpoint where half the homes sold for more and half for less, was $219,300 in the fourth quarter of last year, a drop of 2.7% from the same period a year ago.

Median home prices fell in 49% of the 149 metropolitan areas surveyed in the fourth quarter, compared with the same period a year ago. That was the largest percentage of metro areas reporting price declines since the Realtors began tracking price data in 1979.

David Lereah, chief economist for the Realtors, said he believed the data shows that housing, which had enjoyed a five-year boom, was bottoming out in the final three months of last year.

“This information confirms 2006 was the year of contraction and hopefully the fourth quarter was the bottom,” Lereah said. “When we get the figures for this spring, I expect to see a discernible improvement in both sales and prices.”

Median home prices in 149 metro areas

Metropolitan Area

Price in thousands


2005 Q4

2006 Q4

Change

Akron, OH

117.8

110.2

-6.5%

Albany-Schenectady-Troy, NY

190.8

198.7

4.1%

Albuquerque, NM

174.1

187.5

7.7%

Allentown-Bethlehem-Easton, PA-NJ

245.7

249.7

1.6%

Amarillo, TX

105.4

108.3

2.8%

Anaheim-Santa Ana, CA (Orange Co.)

699.8

690.7

-1.3%

Appleton, WI

129.3

128.4

-0.7%

Atlanta-Sandy Springs-Marietta, GA

170.2

166.8

-2.0%

Atlantic City, NJ

269.9

339.8

25.9%

Austin-Round Rock, TX

167.0

175.2

4.9%

Baltimore-Towson, MD

265.1

277.9

4.8%

Barnstable Town, MA

405.2

373.5

-7.8%

Baton Rouge, LA

153.8

173.4

12.7%

Beaumont-Port Arthur, TX

104.3

120.0

15.1%

Binghamton, NY

95.8

95.8

Unch

Birmingham-Hoover, AL

160.8

161.7

0.6%

Bismark, ND

129.1

127.4

-1.3%

Bloomington-Normal, IL

161.5

151.3

-6.3%

Boise City-Nampa, ID

N/A

209.5

N/A

Boston-Cambridge-Quincy, MA-NH

397.5

388.0

-2.4%

Boulder, CO

349.5

363.1

3.9%

Bridgeport-Stamford-Norwalk, CT

468.5

445.7

-4.9%

Buffalo-Niagara Falls, NY

99.8

96.6

-3.2%

Canton-Massillon, OH

106.1

106.2

0.1%

Cape Coral-Fort Myers, FL

293.1

258.9

-11.7%

Cedar Rapids, IA

133.8

129.2

-3.4%

Champaign-Urbana, IL

142.6

141.6

-0.7%

Charleston-North Charleston, SC

198.4

210.9

6.3%

Charleston, WV

117.3

114.3

-2.6%

Charlotte-Gastonia-Concord, NC-SC

183.5

198.2

8.0%

Chattanooga, TN-GA

132.6

134.6

1.5%

Chicago-Naperville-Joliet, IL

265.6

268.1

0.9%

Cincinnati-Middletown, OH-KY-IN

143.7

138.7

-3.5%

Cleveland-Elyria-Mentor, OH

135.7

130.9

-3.5%

Colordo Springs, CO

209.2

219.4

4.9%

Columbia, SC

136.5

N/A

N/A

Columbus, OH

147.9

138.7

-6.2%

Corpus Christi, TX

131.2

129.7

-1.1%

Cumberland, MD-WV

85.7

98.0

14.4%

Dallas-Fort Worth-Arlington, TX

150.2

144.3

-3.9%

Danville, IL

63.8

N/A

N/A

Davenport-Moline-Rock Island, IA-IL

109.2

116.4

6.6%

Dayton, OH

112.8

119.5

5.9%

Decatur, IL

84.5

89.2

5.6%

Deltona-Daytona Beach-Ormond Beach, FL

208.9

198.6

-4.9%

Denver-Aurora, CO

247.5

245.6

-0.8%

Des Moines, IA

147.2

144.5

-1.8%

Detroit-Warren-Livonia, MI

156.2

154.6

-1.0%

Dover, DE

185.7

200.5

8.0%

Durham, NC

168.7

168.6

-0.1%

Elmira, NY

78.8

78.4

-0.5%

El Paso, TX

118.4

131.8

11.3%

Erie, PA

99.7

102.6

2.9%

Eugene-Springfield, OR

209.0

230.9

10.5%

Fargo, ND-MN

134.6

136.6

1.5%

Farmington, NM

160.5

183.0

14.0%

Ft. Wayne, IN

104.1

101.6

-2.4%

Gainesville, FL

197.7

211.5

7.0%

Gary-Hammond, IN

128.4

123.2

-4.0%

Glens Falls, NY

170.5

174.4

2.3%

Grand Rapids, MI

135.1

129.5

-4.1%

Green Bay, WI

150.1

145.6

-3.0%

Greensboro-High Point, NC

150.0

150.2

0.1%

Greenville, SC

152.2

150.0

-1.4%

Gulfport-Biloxi, MS

147.0

152.0

3.4%

Hagerstown-Martinsburg, MD-WV

222.1

213.9

-3.7%

Hartford-West Hartford-East Hartford, CT

253.8

253.9

0.0%

Honolulu, HI

620.0

620.0

Unch

Houston-Baytown-Sugar Land, TX

146.3

148.6

1.6%

Indianapolis, IN

122.0

117.1

-4.0%

Jackson, MS

142.5

145.3

2.0%

Jacksonville, FL

182.2

180.4

-1.0%

Kalamazoo-Portage, MI

N/A

N/A

N/A

Kankakee-Bradley, IL

123.6

125.7

1.7%

Kansas City, MO-KS

156.5

153.1

-2.2%

Kennewick-Richland-Pasco, WA

157.7

151.2

-4.1%

Kingston, NY

260.0

243.2

-6.5%

Knoxville, TN

148.8

153.6

3.2%

Lansing-E.Lansing, MI

139.1

135.0

-2.9%

Las Vegas-Paradise, NV

315.9

313.5

-0.8%

Lexington-Fayette,KY

150.7

146.3

-2.9%

Lincoln, NE

N/A

137.7

N/A

Little Rock-N. Little Rock, AR

125.9

125.9

Unch

Los Angeles-Long Beach-Santa Ana, CA

568.4

586.5

3.2%

Louisville, KY-IN

134.6

137.6

2.2%

Madison, WI

224.6

225.4

0.4%

Memphis, TN-MS-AR

144.2

141.9

-1.6%

Miami-Fort Lauderdale-Miami Beach, FL

391.2

366.8

-6.2%

Milwaukee-Waukesha-West Allis, WI

214.9

210.9

-1.9%

Minneapolis-St. Paul-Bloomington, MN-WI

230.5

228.3

-1.0%

Mobile, AL

133.7

137.2

2.6%

Montgomery, AL

136.3

139.6

2.4%

Nashville-Davidson–Murfreesboro, TN

170.9

N/A

N/A

New Haven-Milford, CT

279.7

278.8

-0.3%

New Orleans-Metairie-Kenner, LA

178.7

162.1

-9.3%

New York-Northern New Jersey-Long Island, NY-NJ-PA

454.1

464.4

2.3%

New York-Wayne-White Plains, NY-NJ

518.1

498.4

-3.8%

NY: Edison, NJ

383.0

366.9

-4.2%

NY: Nassau-Suffolk, NY

472.4

473.7

0.3%

NY: Newark-Union, NJ-PA

413.9

426.6

3.1%

Norwich-New London, CT

262.1

257.9

-1.6%

Ocala, FL

161.1

170.7

6.0%

Oklahoma City, OK

115.5

123.7

7.1%

Omaha, NE-IA

137.7

136.2

-1.1%

Orlando, FL

261.8

272.1

3.9%

Palm Bay-Melbourne-Titusville, FL

209.5

173.9

-17.0%

Pensacola-Ferry Pass-Brent, FL

168.2

161.4

-4.0%

Peoria, IL

112.7

108.9

-3.4%

Philadelphia-Camden-Wilmington, PA-NJ-DE-MD

215.1

222.3

3.3%

Phoenix-Mesa-Scottsdale, AZ

268.4

262.2

-2.3%

Pittsburgh, PA

114.3

112.2

-1.8%

Pittsfield, MA

210.7

220.6

4.7%

Portland-South Portland-Biddeford, ME

245.7

245.2

-0.2%

Portland-Vancouver-Beaverton, OR-WA

256.6

285.4

11.2%

Providence-New Bedford-Fall River, RI-MA

294.4

291.3

-1.1%

Raleigh-Cary, NC

197.7

226.3

14.5%

Reading, PA

143.2

143.2

Unch

Reno-Sparks, NV

365.5

332.9

-8.9%

Richmond, VA

210.3

229.4

9.1%

Riverside-San Bernardino-Ontario, CA

389.9

406.4

4.2%

Rochester, NY

112.8

111.4

-1.2%

Rockford, IL

114.9

121.5

5.7%

Sacramento–Arden-Arcade–Roseville, CA

380.9

365.1

-4.1%

Saginaw-Saginaw Township North, MI

N/A

N/A

N/A

Saint Louis, MO-IL

138.8

139.5

0.5%

Salem, OR

194.1

223.1

14.9%

Salt Lake City, UT

182.3

223.6

22.7%

San Antonio, TX

137.8

140.6

2.0%

San Diego-Carlsbad-San Marcos, CA

607.4

579.8

-4.5%

San Francisco-Oakland-Fremont, CA

718.7

733.4

2.0%

San Jose-Sunnyvale-Santa Clara, CA

740.0

760.0

2.7%

Sarasota-Bradenton-Venice, FL

367.4

301.3

-18.0%

Seattle-Tacoma-Bellevue, WA

335.0

372.9

11.3%

Shreveport-Bossier City, LA

125.6

131.7

4.9%

Sioux Falls, SD

136.4

133.7

-2.0%

South Bend-Mishawaka, IN

89.9

89.8

-0.1%

Spartanburg, SC

125.6

121.3

-3.4%

Spokane, WA

168.6

189.2

12.2%

Springfield, IL

105.9

94.9

-10.4%

Springfield, MA

198.6

199.4

0.4%

Springfield, MO

120.8

119.4

-1.2%

Syracuse, NY

112.7

115.4

2.4%

Tallahassee, FL

176.4

185.3

5.0%

Tampa-St.Petersburg-Clearwater, FL

223.0

229.7

3.0%

Toledo, OH

112.7

104.8

-7.0%

Topeka, KS

105.2

101.1

-3.9%

Trenton-Ewing, NJ

243.1

289.0

18.9%

Tucson, AZ

246.2

239.4

-2.8%

Tulsa, OK

120.0

128.5

7.1%

Virginia Beach-Norfolk-Newport News, VA-NC

220.5

235.2

6.7%

Washington-Arlington-Alexandria, DC-VA-MD-WV

432.9

421.6

-2.6%

Waterloo/Cedar Falls, IA

106.3

102.9

-3.2%

Wichita, KS

108.7

113.4

4.3%

Worcester, MA

289.5

274.7

-5.1%

Yakima, WA

135.2

144.6

7.0%

Youngstown-Warren-Boardman, OH-PA

86.7

80.0

-7.7%

U.S.

225.3

219.3

-2.7%

Northeast

281.7

274.6

-2.5%

Midwest

168.9

161.8

-4.2%

South

188.7

181.7

-3.7%

West

353.6

355.1

0.4%

NA=not available
Source: National Association of Realtors