Archive for May, 2009

The message from Mayne Island: sharing title is a (relatively) inexpensive route to a getaway home, but value-appreciation is no certainty

Saturday, May 16th, 2009

Fractionally sold and bought, wholly thrifty

Suzanne Morphet
Sun

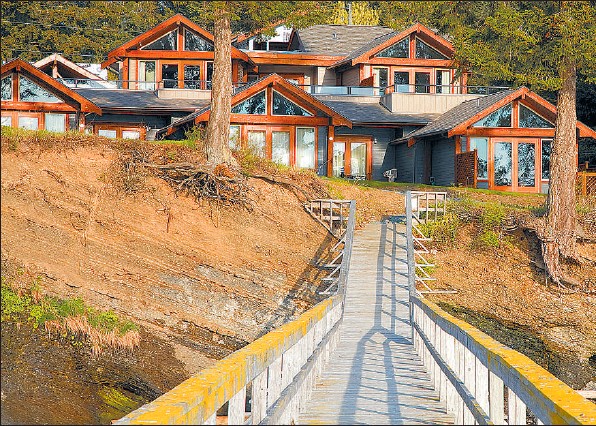
Who could walk from this? Kim Biehl thought about it – briefly – a response to a concern that the economic downturn might prevent or delay completion of the Mayne Island Beach Homes & Resort. Developer Murray Rosengren, below with wife Kim, reports that only two of 66 buyers did not complete. ‘ Our lawyers were telling us, ‘‘ you’ve done well, you’ve got a very good closing rate,’’ which speaks very well for the acceptance and approval of these units by the owners,’ Rosengren says.

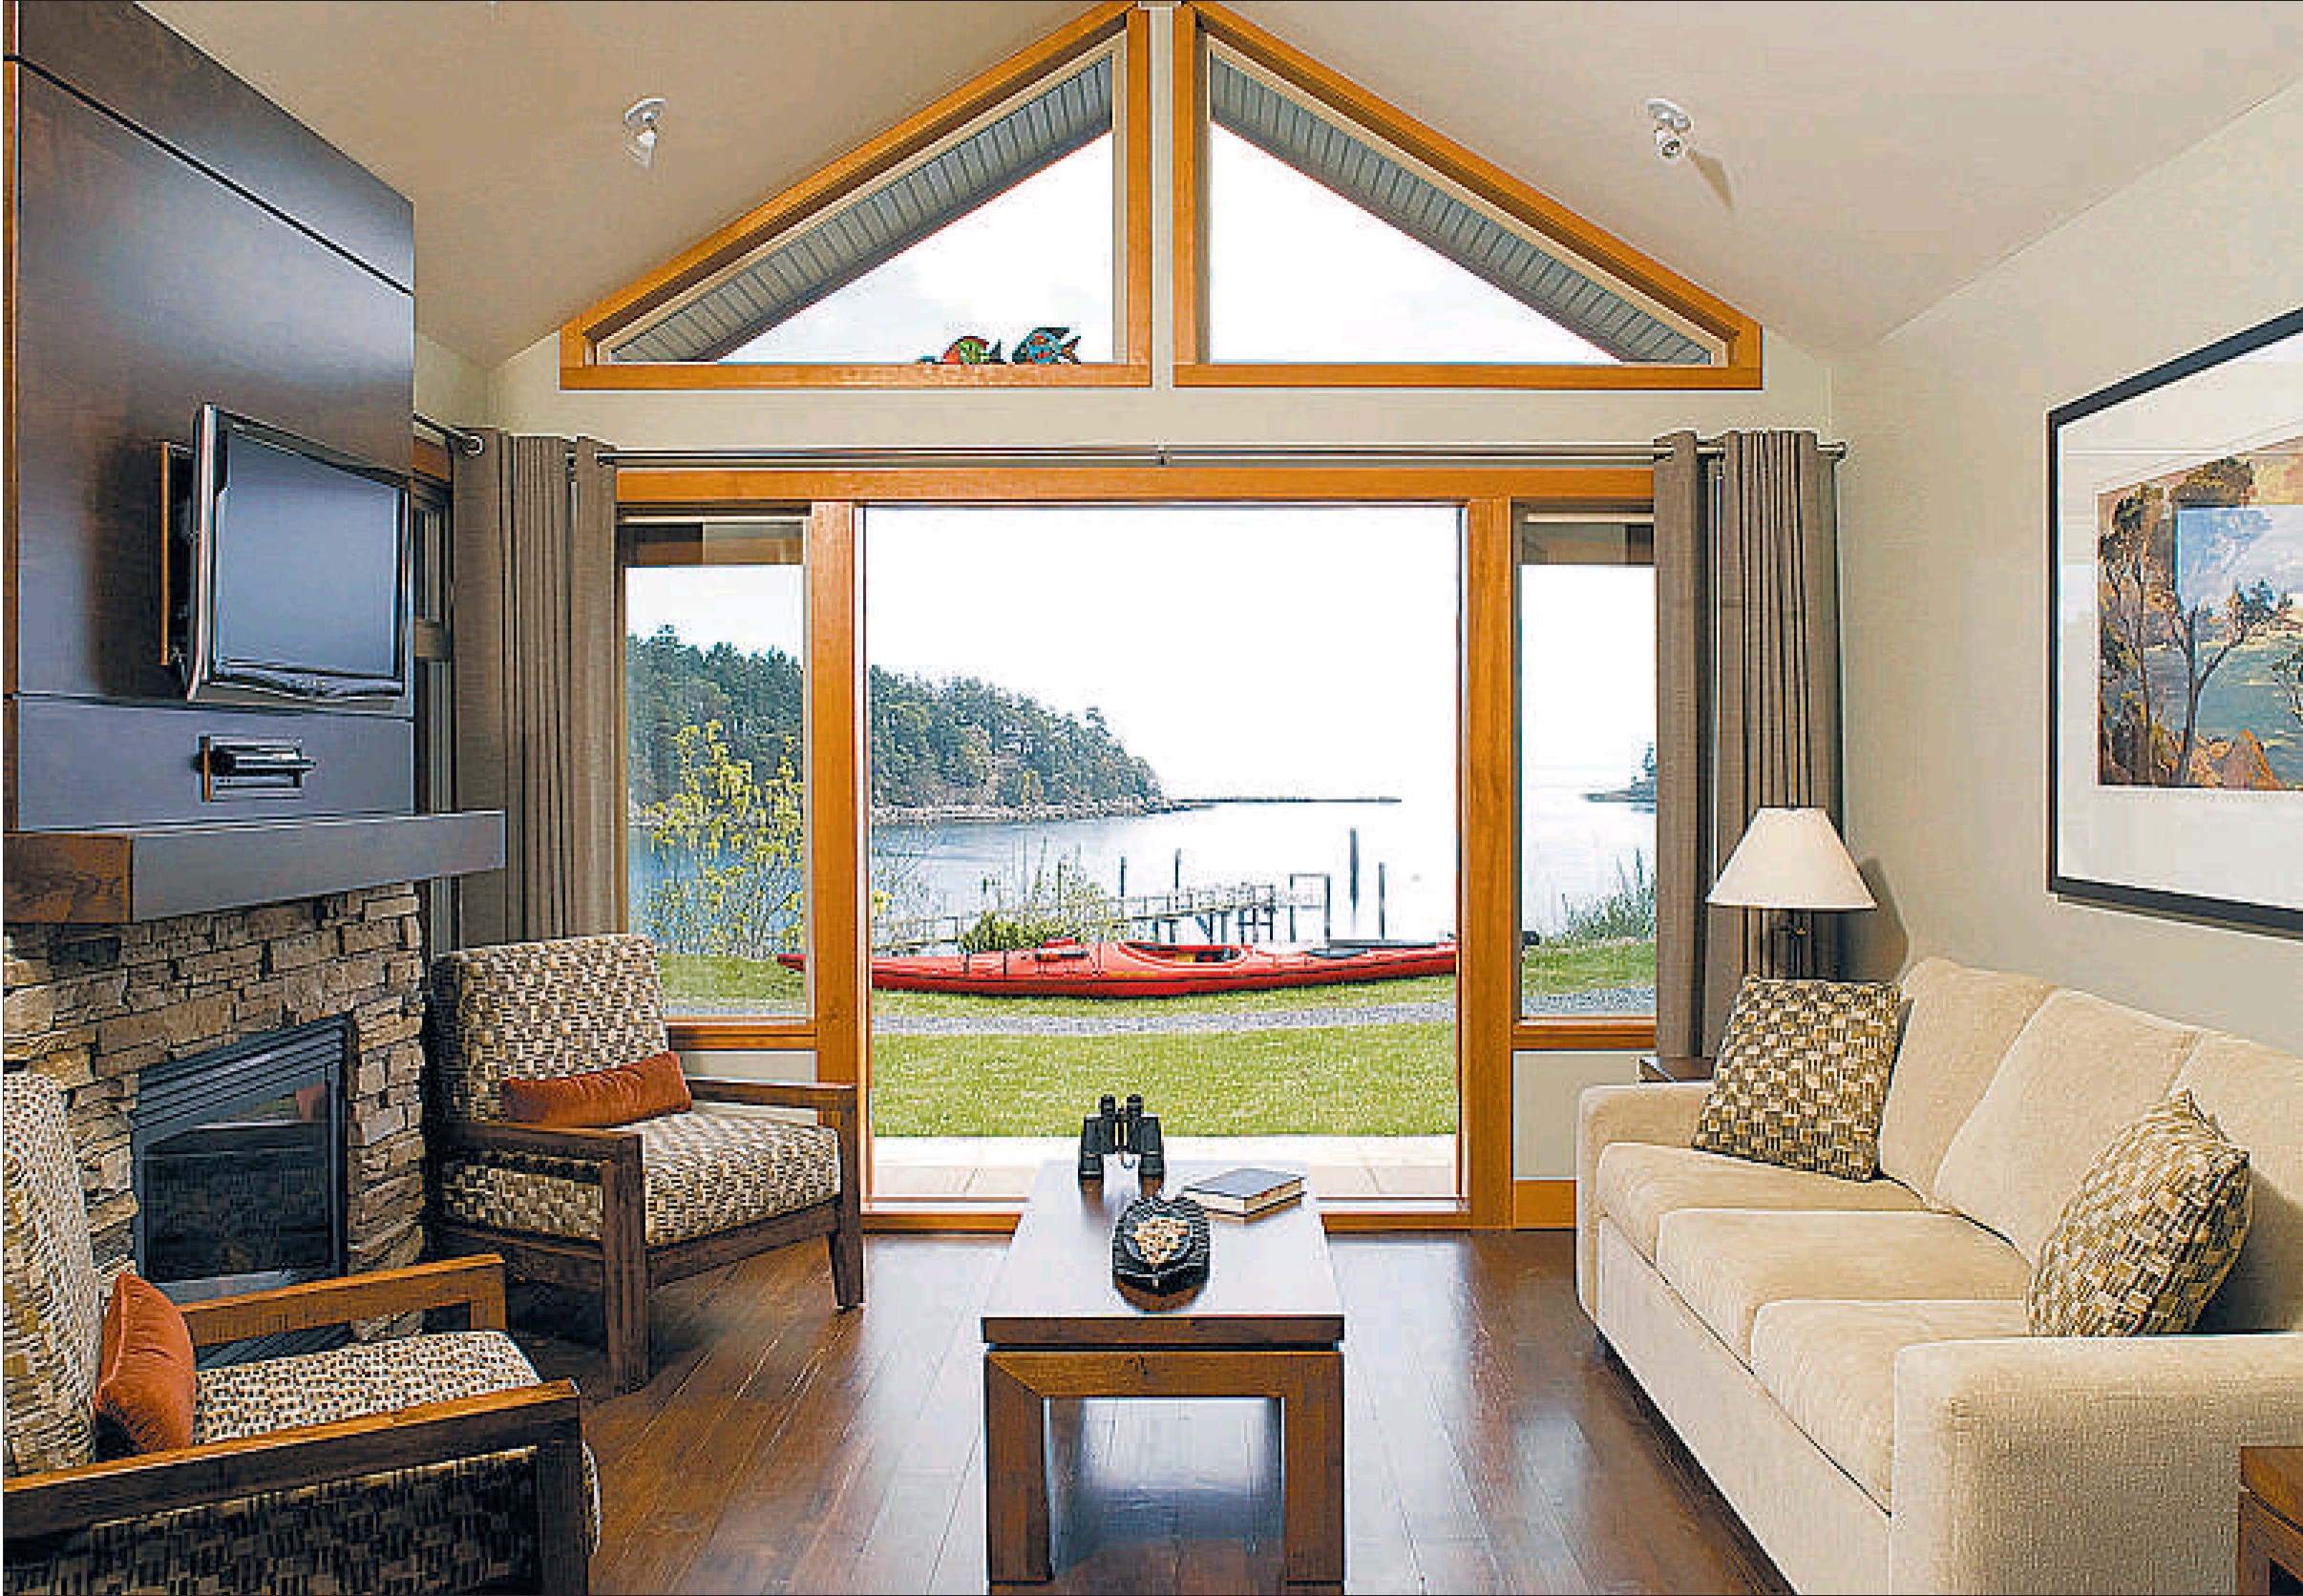
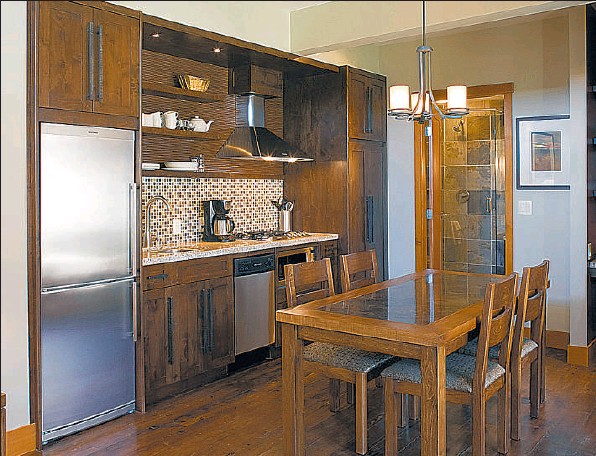
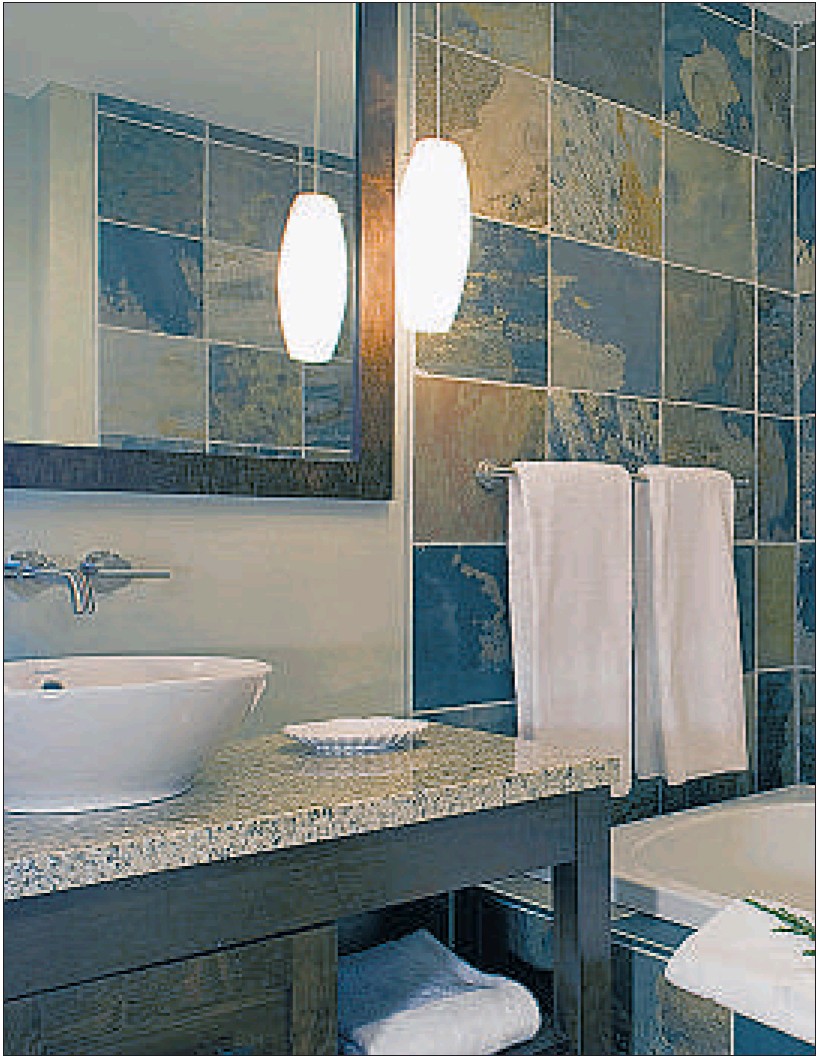
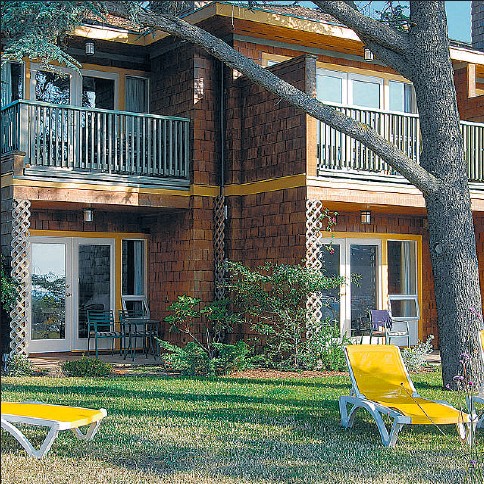
Prices of a one-eighth interest in the title to a Galiano Inn and Spa residence ( left) range from $ 33,900 to $ 98,900. The developer hasn’t dropped prices from last year, but is offering purchase incentives this year. Among them is a break on maintenance fees for two years. For more information on Galiano Inn and Spa call, toll free, 1-877-888-1988. For more information on Mayne Island Beach Homes & Resort call toll free, 1-866-5395399 or e-mail jsquire@ sutton. com.

In December when economic turmoil made champagne the most unlikely of tipples, dozens of new property owners on Mayne Island cracked open the bubbly anyway.

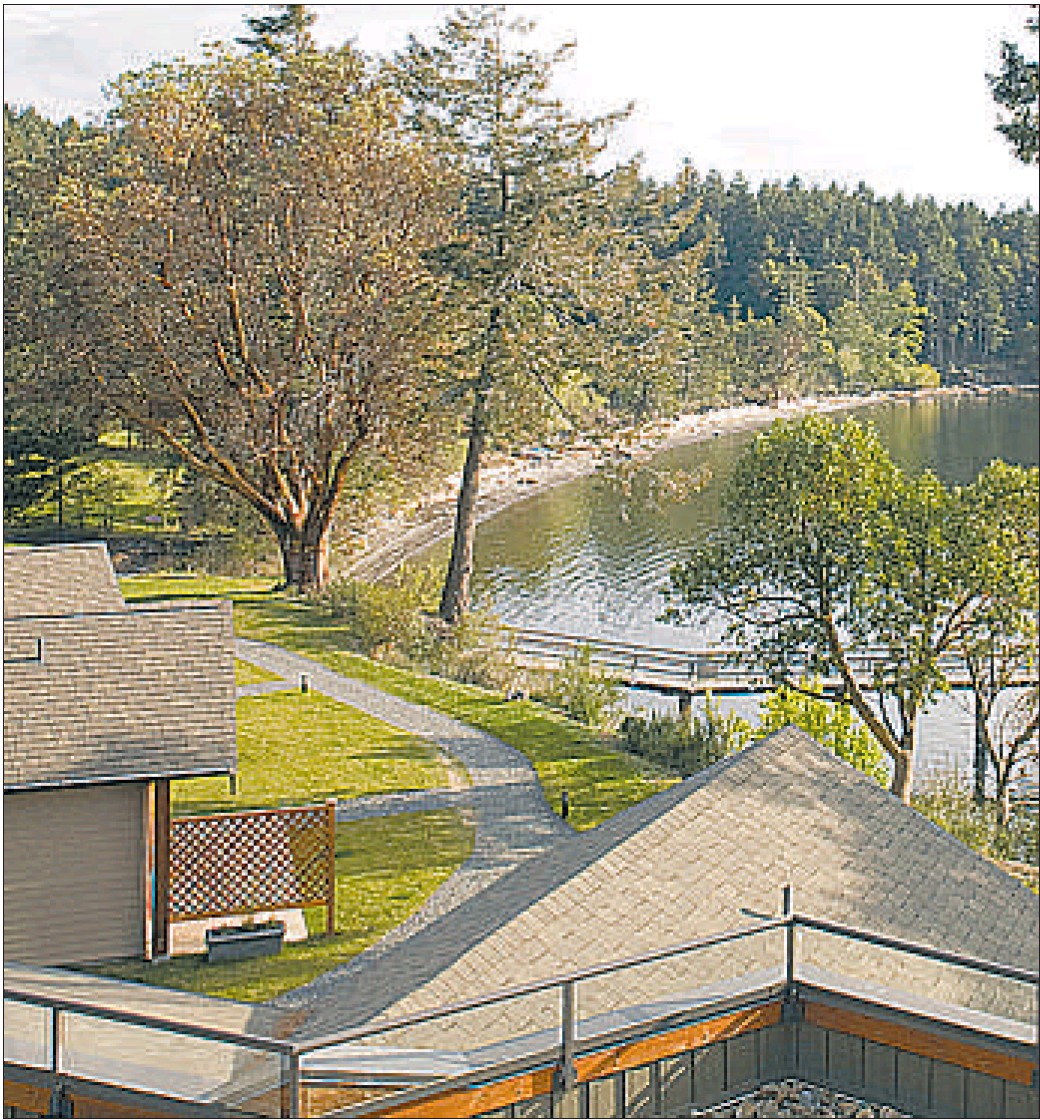
Over the last two years — and they were heady, what-can-go-wrong years — these bubbly-inbibers — mostly from the Lower Mainland – had bought into a fractional-ownership property on picturesque Bennett Bay and called Mayne Island Beach Homes & Resort.

Developer Murray Rosengren was delighted that all but two of 66 buyers put up the remainder of their purchase price and showed up that December day to see their newly completed vacation digs.

“Our lawyers were telling us, ‘you’ve done well, you’ve got a very good closing rate,’ which speaks very well for the acceptance and approval of these units by the owners,” Rosengren says.

Kim and Ken Biehl were present at that ”meet and greet.” With the economy spiralling downward and completion of the first 10 cottages and the promised spa months behind schedule Kim Biehle was concerned Rosengren and partner Dave Hinton wouldn’t be able to get financing to finish the project, she recalls.

Biehl says she briefly considered walking away from the $8,300 deposit. “Briefly, I’ll admit, briefly that thought crossed my mind, but we let it go pretty quickly. It’s been a long-term goal; we could afford it.”

Affordability is the reason most often cited for the popularity of fractional properties.

Developer Rosengren likes to compare buying one-eighth of a Mayne Island Resort cottage, beginning at $59,900, to buying a car.

“I mean you’re not spending much more than you would be if you were buying a vehicle, and what’s that car going to be worth in four years and what’s your vacation property going to be worth?” he asks.

The president of Whistler Real Estate Company, the largest real estate company in the Whistler area, agrees that fractional ownership is more affordable, but Pat Kelly contends these properties don’t appreciate in the same way that single-owner properties tends to.

“I have yet to see any fractional real estate that has appreciated significantly in value in the last 10 years.

 . . fractional developers and time-share (developers) will always tell you it goes up in value, that there’s a ready secondary market for it. Well, I’m not sure they’re the best people to give you that information.”

Rosengren acknowledges that the cottages at his resort have not gone up in value and they have actually gone down, some way down.

“We’ve adjusted some of our prices significantly, that is true . . . people expect it in today’s market. An example, our most expensive unit sold last year for $98,000 and it’s currently offered at $88,000 . . . that is a fact.”

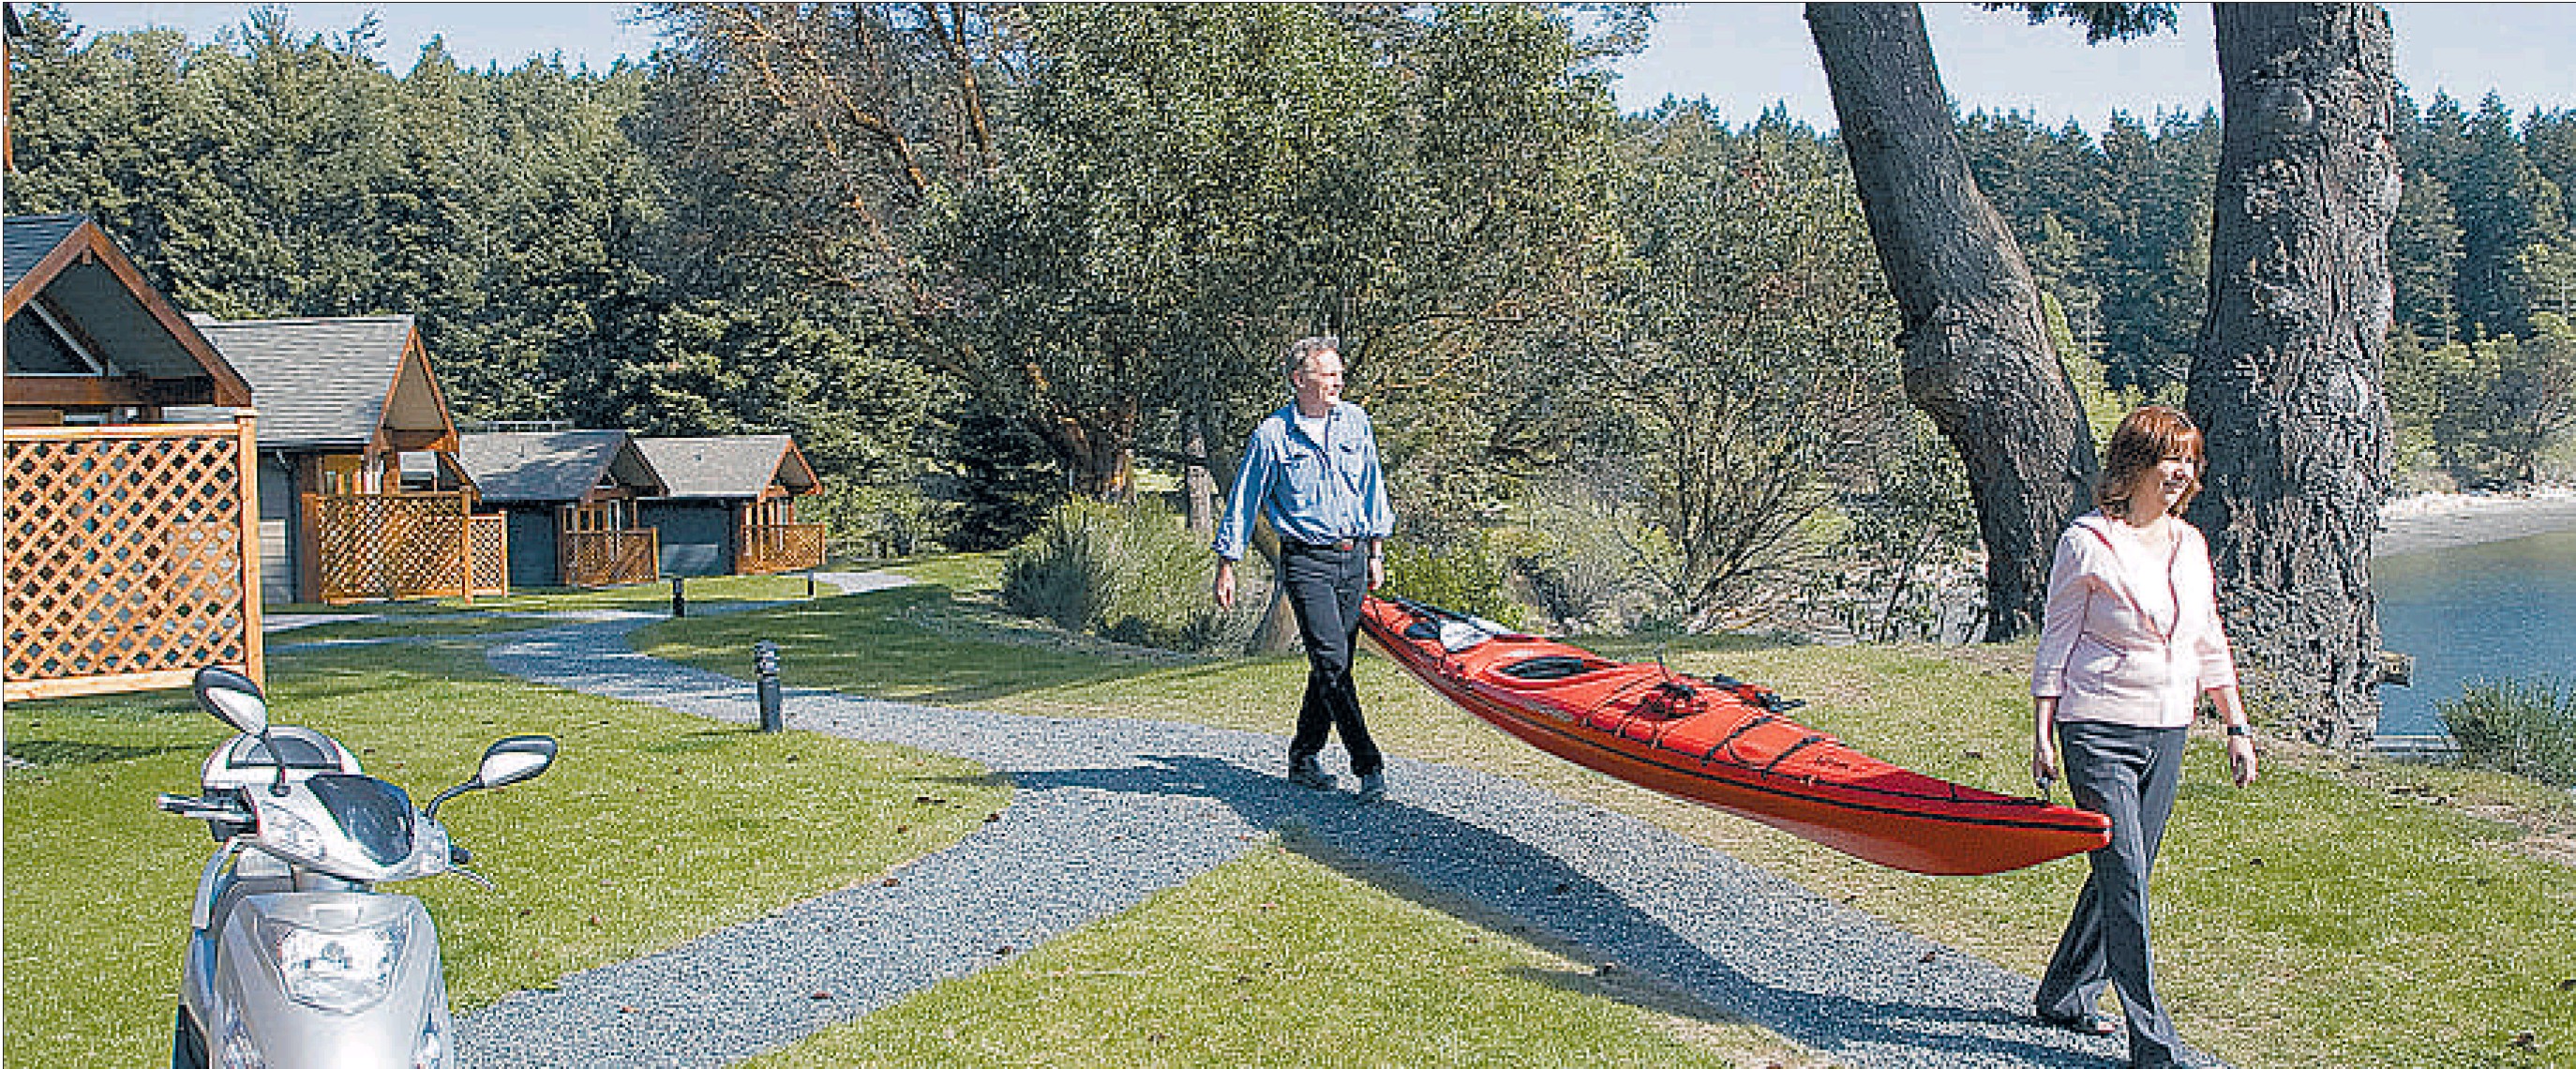
On average, prices at Mayne Island Resort have dropped by eight per cent. Rosengren is also dangling other incentives to attract new buyers. They can choose from a pair of electric scooters, a couple of kayaks or no maintenance fees for two years.

Rosengren is eager to please customers who’ve already bought in and who want to see the rest of the development, including the spa with indoor lap pool, finished: ”we’re not going to hold out for prices that maybe aren’t working.”

On neighbouring Galiano Island, the developers of the Galiano Inn and Spa have sold 60 of the 160 fractions available in the 20-residence beachfront resort.

They have not lowered prices from last year – prices range from $33,900 to $98,900 for a one-eighth share – but new buyers are being offered incentives.

They can take the developer up on financing, or choose between guaranteed leasing for some of the six weeks the property is theirs, or get a break on maintenance fees for two years.

“I think we weathered the storm quite well, I think we’ll be fine,” says Galiano Inn’s realtor Ian Watts, who says it can take years for fractional properties to completely sell out. “Absolutely, I know one in Whistler, they’ve been selling it since ’02.”

“Of course we’re looking forward to more owners, there’s no question of that,” says Connie Nordin, co-owner of the Galiano Inn and Spa, “but at this point we’re pleased that we can be fully operating for both the owners and prospective owners and guests.”

Being able to indulge themselves at the resort’s award-winning restaurant and spa is a comforting thought to buyers who want some pampering after the punishment they may have suffered on the stock market. In fact, Nordin says buyers make a point of comparing the two kinds of investments, telling her, “Yea, I could put it (money) into stocks again, but really, I’m not able to enjoy that. If I’m putting it into a fractional ownership I can enjoy it tomorrow.”

While buyers – and some developers – like to compare fractional ownership with other kinds of financial investments, it’s not a good idea, according to Ross Perlmutter, president of the Canadian Resort Development Association, a national organization representing developers of timeshares and fractional properties.

Perlmutter says fractional properties should be viewed the same way you would look at buying a membership in an golf or ski club.

“As an investment, you could definitely do much better with something more traditional such as treasury notes or blue chip stock, but you also wouldn’t experience the pleasures of the private golf club experience. The same could be said for buying an exotic sports car or a Harley; they might be good investments, but the real reason people purchase products like that is to enhance their ‘lifestyle portfolio.’ ”

Perlmutter is candid about the future value of fractional properties, especially if the economy continues to be unstable, saying it depends entire on the ability of people to sell them.

“If the realtors – or others in the resale market – understand the product and market it properly, they could hold their value.

”On the other hand, if the owners feel the need to unload them – for example, due to financial hardship – and they are willing to sacrifice them for half of what they originally paid . . . anything could happen.”

Perlmutter estimates about 300,000 Canadians own fractional properties and that about 120 resorts offer or have previously offered some form of shared ownership. Sales in Canada in 2008 totalled about $800 million.

He believes the market for fractionals is still growing and cites a recent announcement by Calgary-based Bellstar Hotels and Resorts of an Okanagan development.

On the coast, the developers of both the Galiano Inn and Spa and Mayne Island Resort are looking forward to summer and more buyers.

Mayne Island Resort is holding a grand opening this weekend. The Galiano Inn has scheduled a pizza party on the ocean-front terrace from a new wood-fired pizza oven.

Kim and Ken Biehl recently enjoyed their third visit to their property at Mayne Island Resort, and says they have no regrets. “Absolutely none, it was the right thing to do at the right time and it’s a great place.”

Suzanne Morphet is a freelance writer in Victoria and co-author of The Vancouver Island Book of Everything.

© Copyright (c) The Vancouver Sun

Restoration insurance needs green overhaul

Friday, May 15th, 2009

MIKE HOLMES
Sun

If you demand that your contractor use an eco-friendly mould inhibitor like Bluwood, they will.

Restoration contracting is a complicated business — a good contractor needs to have experience and knowledge in emergency response: demolition and tear out, cleaning, smoke and water mitigation, mould remediation. They also must understand structure, framing, insulation, drywall, trim, finishes — the list goes on.

They also need to know how to deal with insurance adjusters and companies — and manage homeowners’ expectations at a difficult time.

Most policies state that damage must be returned to the “ pre-loss condition.” That means standard insulation and drywall, paint, carpet — whatever was there before the flood. But what if you want your home rebuilt to a better standard, to a greener standard?

Will your policy cover the additional cost of installing new green features ( that weren’t there before) such as using upgraded materials, or upgrading conventional HVAC and mechanicals to more energy efficient models? Probably not — unless it’s specifically covered by your insurance policy. Green products are generally speaking more expensive, and less available, and so won’t be covered by a standard replacement cost policy.

So, who’s going to pay the difference — the restoration contractor? I don’t think so. They are already being squeezed by the insurance company — there’s no room in their margins to go “ better” on products. Should the contractor upsell” the homeowner, and have them pay more for better materials than are covered by the policy? Or should that be covered by your policy?

Your insurance company isn’t going to be motivated to spend more money on green or ecofriendly building materials if they cost more. Insurance companies want to keep their money — I get that. Unfortunately, that means a lot of homeowners end up just having the original materials replaced, even when they might be a poor choice. I’d rather not see batt insulation and standard drywall going into a basement. Why not use spray foam and mould resistant drywall instead?

I believe that you do it right the first time. If you have to tear out, that is the time to start fresh, and use the best materials and best techniques available — the most energy efficient, eco-friendly and mould resistant.

It would be great if homeowners had the chance to green their systems if there was an insured loss, rather than just restoring the building to its original pre-loss condition. Homeowners could upgrade damaged building systems — from the building envelope to HVAC to plumbing and lighting — to higher performance systems. That means using mould-resistant caulking and drywall and insulation and mould inhibitors sprayed on wood. They could also improve on carpets, paint and interior finishes — going no/ low VOC, for example.

Some insurance companies offer policies that allow you to upgrade in a claim to more environmental building materials like higher efficiency windows and insulation. Why wouldn’t you choose, for a modest increased premium, to insure that any future restoration is done to a green or improved standard? More insurance companies should sell this coverage to homeowners — coverage that allows them to rebuild to a greener standard that is more sustainable and has less impact on the environment.

Maybe in the future insurance companies will offer a reduced rate to insure your house if it’s green. Makes sense to me: A reward for energy efficiency and environmental building and committing to green building standards. If you think about it, when the systems are engineered to a better standard of performance the building is less of an insurance risk. If every house were made with mould-resistant material or non-combustible material there’d be less risk and loss.

Green products are not as expensive as many people seem to think. The real problem is that they aren’t as readily available and it may be harder — especially in more remote areas — to find them. They don’t have to cost more — it’s supply and demand. Right now, they are special-order items. As they become standard stock items, their cost will come down.

Remember it wasn’t that long ago that energy-efficient appliances were more expensive, and only available by special order. Now they are standard, stocked in stores and everyone buys them. Years ago, tile underlay was unknown in North America. Now that consumers have seen it used on television and understand why it’s a better product, they request it from their contractors. It used to be special order — now it’s on the shelf everywhere.

That’s how it is with green and mould-resistant products. They are available, but only as special order items. When the big box stores start to stock them, and train their staff to understand why they are better so they can educate the consumer, they’ll be standard.

If you demand that your painter uses low/ no VOC paints, he will. If you demand that your contractors use mould-resistant drywall or a mould inhibitor like BluWood on studs or spray foam insulation, they will. Of course they will — you are the boss.

In the end, consumer demand dictates everything: What you want your restoration contractor to put back into your home, what your insurance policy will cover, and what green products are available in stores. Speak up.

A Queen Anne gem, unpolished

Friday, May 15th, 2009

Unrenovated house retains most of its original character from nearly a century ago

John Mackie
Sun

A turret and a brick-and-stone facade are the hallmarks of a handsome Queen Anne-style heritage home at 356 West 11th in Vancouver. It cost $6,000 to build in 1910, and is now for sale for $1.94 million. It is one of only 263 Heritage A buildings in Vancouver, the city’s highest ranking. Photograph by: Ward Perrin, Vancouver Sun

The windows in the home’s turret provide a panoramic view to the north. Photograph by: Ward Perrin, Vancouver Sun

Houses tend to change over the years. New owners come in and put their personal stamp on the property by upgrading this or renovating that. Sometimes it improves the place, but often, “modernizing” something wrecks it, taking away the original character.

In any event, there are precious few houses in Vancouver that are in original, unrenovated condition. One of them has gone up for sale at 356 West 11th, for $1.94 million.

This may seem a bit steep in today’s uncertain economic climate, particularly since the 3,700-square-foot home needs a new roof, kitchen and bathroom.

But man, what a house.

Many Vancouverites will recognize it because it’s just east of city hall at 11th and Yukon. It sits high up on a hill, which gives it a real prominence and grandeur. Unlike other old homes in the neighbourhood, the house has never been broken up into suites; it still retains its original layout.

It dates to 1910, and is in the Queen Anne style, with a big turret on the northwest corner. The exterior is a handsome blend of brick and stone, with an enormous front porch. There may not be another building like it in the city. It’s more like a Westmount mansion in Montreal than something you’d see in Shaughnessy.

It’s so striking, it’s one of only 263 Heritage A buildings in Vancouver, the city’s highest ranking.

The inside is definitely in need of some work, but has heritage character galore. There is wood panelling in the hallway, den, dining room and stairwell, plate rail in the dining room, and picture rail in most every room.

Most of the wood has never been painted, and has that lovely patina you get on century-old fir with a dark stain. This includes a stunning 6-foot-tall, 6-foot-wide built-in cabinet in the dining room.

The first and second floors have 10-foot ceilings, and the downstairs ceilings are coffered, with all the original moulding. The pocket doors still have their original keys, and the keys actually work.

Naturally there is a lot of stained glass, including a butterscotch arched window in the dining room and a green, amber and milky blue art-nouveau-style window in the upstairs landing.

One of the house’s many quirks is that there are small stained-glass windows in two of the upstairs bedroom closets. Oddly, there isn’t any stained glass in the actual bedrooms.

How many bedrooms the house has is hard to determine. Depending on how you look at it, there could be three, four, or seven.

How so? When it was built, there were probably three bedrooms on the second floor, including a luxurious master suite across the front of the house. The master would have included a bedroom beneath the turret, which is connected to a small room that was used as a walk-in closet, which in turn is connected to a sitting room with a gorgeous tiled fireplace.

In recent years, the sitting room has been used as a bedroom, hence there could be four bedrooms on the second floor. But there’s also a third floor that would have been the servants’ quarters. It has three rooms that could be used as bedrooms, so in a pinch the house could have seven bedrooms. Or more, if you developed the basement.

The view from the third floor is stunning, particularly from inside the turret, where you get a jaw-dropping panorama of the North Shore mountains and downtown. Alas, the western view of False Creek and English Bay was cut off when they built an addition to Vancouver‘s city hall.

The house was there 25 years before city hall. Rogers Park used to be located where city hall is today, so it would have bordered on a lush expanse of greenery.

It was designed by Milton D. Campbell and Francis E. Burnett, who built several other grand homes in Mount Pleasant just before the First World War. The original owner was Murdock McLean, who is listed in old city directories as a “bookkeeper” and a “landing waiter” at customs.

Not much is known about McLean, but his death in 1917 did rate a mention in the Province newspaper, which said he was a Vancouver pioneer. The Province story says he came to Vancouver in 1886, the year the city was founded, but he doesn’t show up in a city directory until 1893, which is a more likely date.

McLean prospered enough to spend $6,000 constructing his dream home in 1910, but he lived in the house for only seven years before he died at the age of 72. The McLean family remained the owners until Murdock’s son Frederick died in 1944, when it was sold to William Bodnar.

Bodnar’s claim to fame is that he co-owned the Hotel Europe for a few years in the early 1950s. The current owner, Donald Walters, said Bodnar was forced to sell the Europe and three other hotels because one of his partners was embezzling money. The partner was caught and hanged himself in jail.

The Bodnar family still has a connection to the house today. William handed it to his son Henry, who died and left it to his wife Kaye, who died and left it to her second husband, Walters. Walters has had health problems and decided to sell the house because he can’t afford the upkeep.

Hence, the reason the house is more or less like it was in 1910 is that basically, it has been owned by only two families. So you still have the original bench in the hallway, you still have the original chandeliers in the den and dining room, and you still have 1930s wallpaper and ancient push-button light switches.

Quirks? It has a nifty little doo-dad in one of the upstairs bedrooms that controls all the lights in the house; flip it and you can turn out the front hall. It still has the 1910 built-in central vacuum system, although it’s no longer functioning. The garage out back used to be a barn for McLean‘s horse and buggy.

The house is so unusual, it’s been used in several films and TV shows, such as the remake of the horror flick Willard, as well as TV shows The X-Files, Six Feet Under and Just Cause.

It makes sense that the movie business would like the house. It’s so 1910, it almost seems like a Hollywood movie set.

© Copyright (c) The Vancouver Sun


CREA forecast BC prices to drop an average of 7% in 2009

Friday, May 15th, 2009

Derrick Penner
Sun

A recent surge in real estate sales has caused the Canadian Real Estate Association to sharply revise its expectations for price drops in British Columbia.

CREA, in its forecast released Thursday, estimated that B.C.’s average price will drop less than seven per cent over 2009, more than three percentage points off the 10.6-per-cent drop forecast in February.

CREA forecast that B.C.’s average price will drop to $423,300, instead of the $406,300 average it forecast earlier.

For 2010, CREA is now predicting that B.C. prices will start edging up again by almost two per cent compared with a 2010 drop of 0.6 per cent written into the February forecast.

“Monthly resale housing activity improved as the first quarter progressed,” Gregory Klump, CREA’s chief economist, said in a news release, “entering the second quarter on a rising trend [that is] closing in on levels last seen before [the sales trend] fell sharply late last year.”

B.C. sales rose in April from the previous month, the B.C. Real Estate Association said Thursday in a news release, as buyers were drawn back into the market by lower prices and rock-bottom mortgage rates. And the inventory of unsold homes across the province dropped to the lowest level in 12 months, the association said, edging the ratio of sales to active listings close to the zone housing economists consider balanced between buyers and sellers.

“An increase in consumer demand combined with fewer homes for sale has trended the market near balanced conditions,” Cameron Muir, chief economist for the B.C. Real Estate Association said in an interview.

Realtors counted 6,918 sales through the Multiple Listing Service in April, down 20 per cent from the same month a year ago. April was the third straight month that sales were higher than the previous month. However, to the end of the first four months, sales were still lower than a year ago with realtors counting 18,089 sales, a 35-per-cent reduction over the first four months of 2008.

The average house price across B.C. was $433,246 over the first four months, down almost nine per cent from a year ago.

© Copyright (c) The Vancouver Sun

New website lets you track YVR aircraft and the noise they make

Friday, May 15th, 2009

‘Now residents can know exactly what is flying in their area’

Gerry Bellett
Sun

The Vancouver Airport Authority has launched a website that will track the flight paths of commercial aircraft flying over Metro Vancouver.

The website, which can be found at www.yvr.ca/webtrak, allows the public to view flights as they occur with a short delay for security reasons, said South Surrey-White Rock-Cloverdale MP Russ Hiebert.

“This website is the first of its kind in Canada. It shows in real time where planes are flying, how high they are and it also displays the resulting noise level at several ground monitoring stations, including a brand new one in Crescent Beach,” said Hiebert.

“I am pleased this website is up and running. Residents asked for it so I lobbied NAV Canada to amend its legal agreement with the Vancouver Airport Authority so that flight and noise data could be viewed by the public,” said Hiebert in a news release.

“Now residents can know exactly what is flying in their area. Residents asked for more accountability from NAV Canada and I believe this website is an important step forward,” he said.

There are 20 noise-monitoring stations in Metro Vancouver.

The webtrack displays a map of the region and current flight and noise activity. A visual key identifies aircraft type, elevation and noise level and whether it is arriving or departing.

There is also a function to enable flights to be traced back 30 days as well as a means for residents to place comments.

The website is also the result of lobbying by SCAAN (Surrey Citizens Against Aircraft Noise) and the Surrey Airspace Taskforce after residents complained of aircraft noise pollution as a result of new flight paths being used by aircraft entering Metro Vancouver airspace.

Don Pitcairn, a member of SCAAN and the president of the Surrey United Naturalists, said Hiebert’srelease failed to mention the role played by the two Surrey organizations in convincing the airport authority to provide the data.

“Typical politician trying to get the glory,” said Pitcairn who ran for the Green Party in the Surrey-White Rock riding in this week’s provincial election.

The website shows all planes taking off or landing at the major airports in Metro Vancouver including aircraft using Vancouver harbour.

For security reasons the website won’t show military or RCMP flights.

YVR media relations officer Alana Lawrence said to overcome security concerns relating to commercial flights transmission of flight data was delayed by 10 minutes, by which time the flight was well clear of the area or had landed.

© Copyright (c) The Vancouver Sun

B.C.’s residential housing shows slight signs of recovery

Friday, May 15th, 2009

April hike means home sales do better for third month in a row

Province

House prices in B.C. have yet to recover but the residential market is beginning to find its feet again, the B.C. Real Estate Association says.

The average house price across the province last month fell six per cent to $449,372 from $478,044 a year earlier, the association said yesterday.

But April marked the third-consecutive month of rising home sales in B.C., on a seasonally adjusted basis, the association said.

Lower home prices and record-low mortgage-interest rates have strengthened consumer demand, the association said.

The beginning of April saw housing affordability touch a three-year high.

And the number of homes for sale on the Multiple Listing Service sank to a 12-month low in April, seasonally adjusted.

“Downward pressure on home prices has eased considerably,” association chief economist Cameron Muir said.

“An increase in consumer demand combined with fewer homes for sale has trended the market near balanced conditions.”

In Greater Vancouver, average prices in April were down 8.2 per cent to $565,003 from last year.

Residential sales volume in B.C. fell 24.6 per cent to $3.1 billion in April from a year ago. Year to date, sales lost 40.5 per cent to $7.8 billion from the same period last year.

The year-to-date average MLS price sank nine per cent to $433,246 from a year earlier.

Nationally, home sales surged in April, a third-consecutive monthly increase, which forced the Canadian Real Estate Association to revise its forecast.

On a seasonally adjusted basis there were 34,838 unit sales last month, an 11.2-per-cent increase from March and the largest monthly jump in sales since March 2004.

The average price of a home sold in April was $306,366, a 3.2-per-cent decline from a year ago.

Because of its renewed confidence in the market, the association is now forecasting sales will come in at 370,500 for 2009, up from the 360,900 in sales the group was forecasting in February.

But even the renewed forecast would be a 14.7-per-cent drop in sales from a year ago and a far cry from the record 523,855 in sales in 2007.

© Copyright (c) The Province

Not a good spot for weight-watchers

Thursday, May 14th, 2009

Deacons Corner serves up trucker-style meals that are satisfying, filling and likely to expand your waist size

Mia Stainsby
Sun

Chef Patchen Gallagher and the all-day breakfast at Deacon’s Corner Gastown Diner. Photograph by: Ian Lindsay, Vancouver Sun

DEACON’S CORNER

101 Main St., 604-684-1555.

Open 7 to 3, Monday to Friday; 10 to 3 on weekends.

www.deaconscorner.ca

– – –

When I dropped into Deacons Corner one weekend morning, it was sartorial convergence. Every person, to a knee, wore jeans. Tight jeans, droopy jeans, jaunty jeans, mom jeans, low-rise jeans, the works. It’s the universal language of casual, I suppose, and casual you want to be at the corner of Main and Alexander.

When I saw my hefty plate o’ food I panicked about my skinny jeans, and can tell you I did not depart very sveltely with my newly acquired muffin-top waist. I walked beyond the overpass to Crab Park to sit and rest on a grassy knoll.

But skinny jeans do not concern chef Patchen Gallagher. (He’s named after American poet Kenneth Patchen, who, like e.e. Cummings, used words so deliciously.) He makes big honkin‘ breakfasts.

Deacon’s Corner is open for Bunyanesque breakfasts, brunches and lunches. I try not to mention the recession, but here I go again: Deacon’s does have recessionary appeal with its friendly prices (an average $6 to $10 for breakfasts and lunches, fully loaded) and a throwback feel of roadside diners of the ’50s and ’60s. And how perfect is this? Corner Gas star Brent Butt has been in a few times. Now that the sitcom has wrapped, why not Deacon’s Corner, Brent?

Deacon’s Corner even has a Prairie connection — it takes its name from a Saskatchewan cafe run by the grandfather of one of the owners. (Deacon’s owners are the trio from Cobre, the nuevo Latin restaurant in Gastown.) Gallagher’s “crowning achievement,” he says, is the BLT with house-made bacon patties, more bacon belted around the patties (for a crunch) — six rashers in all, besides the L. and T. The breads are all from Swiss Bakery and of good quality.

The menu includes many permutations of bacon/sausa-ge/eggs/omelettes. The Hungry Man comes with a six-ounce sirloin steak, three eggs, hashbrowns and toast — for $13.50. There are pancakes and there’s French toast. I order French toast and find out later from Gallagher that I consumed half a loaf of challah-like bread. “A loaf is eight inches — two orders,” he says. (I revise: It was a challah-top spilling over my jeans, not muffin.)

A warning: His pancakes use three cups of batter. My partner’s Mexican scrambled omelette threatened to drop off the side of the plate. The lunch-y dishes stick to your ribs — meatloaf (“we grind our own meat, pork and beef, with onions ground right into it,” says Gallagher); pulled pork sandwich, Reuben, chicken fried steak, burgers, chili, mac ‘n’ cheese. Some of the dishes pull you down to the southern U.S. — the country gravy has southerners coming back time and again. It’s got bacon fat, onions, sausage, chicken stock and cream. “Best compliment I got was from a guy from down south whose grandmother passed away. After he had our biscuits and gravy, he said whenever he wants to visit his grandma, he can come here,” says Gallagher. “The food has resonance.”

He adds: “No one leaves feeling sick. One guy ordered a burger topped with chili and fried eggs for nine days straight before he finally broke.”

Restaurant visits are conducted anonymously and interviews are done by phone.

© Copyright (c) The Vancouver Sun


Home sales rise in 17 states as foreclosures depress prices

Wednesday, May 13th, 2009

Julie Schmit
USA Today

A bidder assistant points out bids at a foreclosed home auction in April in San Mateo, Calif. By Justin Sullivan, Getty Images

Sales of existing homes picked up in 17 states in the first quarter compared with the previous one, pointing to more signs of life for the home market.

Nationally, first-quarter sales of existing homes were down 3.2% from the last three months of 2008 and down 6.8% year-over-year, the National Association of Realtors said Tuesday.

But the improvement in 17 states is more evidence that the market is bottoming out, economists say. In the fourth quarter, only nine states showed better sales. Economists predict more states will show sales gains throughout the year, given still-falling prices in many markets, low mortgage rates and some signs of improvement in the overall economy.

“There are early signs of recovery in some states. They give me reason for optimism,” says Patrick Newport, economist at IHS Global Insight. He expects home sales to pick up nationwide in the later part of this year.

The pace of the pickup this year may “surprise to the upside,” says Greg McBride, senior financial analyst at Bankrate.com. That’s because prices have dropped so much that more people can afford homes, he says.

That trend continued in the first quarter. Single-family home prices declined year-over-year in 134 of 152 metropolitan areas, NAR says. Nationwide, the median sales price for a single-family home was $169,000, down 13.8% from the same quarter a year ago. Median means half sold for more and half sold for less.

Median prices are skewed downward by the number of foreclosed and distressed homes being sold. They’re selling for 20% less than traditional homes and account for about half of all sales, NAR says.

That’s attracting many first-time buyers, who accounted for about half of the quarter’s sales, NAR says.

Low prices — driven by sales of foreclosed and distressed homes — helped Minnesota post a 12% gain in the first quarter compared with the same period a year ago, NAR says. Median prices there are at 1997 levels, says Christopher Galler, chief operating officer of the Minnesota Association of Realtors. He says foreclosures and short sales — in which banks forgive some of what is owed — account for 50% of transactions.

That’s also true nationwide, NAR says. The glut of distressed homes on the market will continue to be a “drag on prices,” McBride says.

The states with the largest sales gains from the fourth quarter were: Wyoming, 44%; Alaska, 37%; Nevada, 25%; and Minnesota, 22%. The figures include single-family homes, condos and co-ops.

Metro area median home prices

Median sale price of existing single-family homes in these metropolitan areas (in thousands)


2006

2007

2008Q1

2008Q4

2009Q1

Change from Q1 2008

Akron, OH

$114.6

$119.3

$96.3

$86.1

$50.1

-48.0%

Albany-Schenectady-Troy, NY

$195.4

$198.9

$194.1

$193.1

$184.5

-4.9%

Albuquerque, NM

$184.2

$198.5

$190.5

$183.7

$182.6

-4.1%

Allentown-Bethlehem-Easton, PA-NJ

$248.1

$260.8

$237.0

$238.0

$218.0

-8.0%

Amarillo, TX

$114.9

$118.4

$122.2

$122.6

$122.0

-0.2%

Anaheim-Santa Ana, CA (OrangeCo.)

$709.0

$709.5

$607.4

$464.8

$435.8

-28.3%

Appleton, WI

$129.2

$130.0

$120.4

$127.6

$110.3

-8.4%

Atlanta-Sandy Springs-Marietta, GA

$171.8

$172.0

$154.0

$129.2

$115.6

-24.9%

AtlanticCity, NJ

$254.8

$269.7

$277.4

$229.1

$219.1

-21.0%

Austin-Round Rock, TX

$173.7

$183.7

$184.5

$184.8

$182.3

-1.2%

Baltimore-Towson, MD

$279.9

$286.1

$270.5

$260.1

$245.8

-9.1%

BarnstableTown, MA

$389.5

$384.7

$355.2

$325.5

$276.7

-22.1%

Baton Rouge, LA

$169.5

$174.4

$169.2

$156.4

N/A

N/A

Beaumont-Port Arthur, TX

$112.7

$123.0

$122.9

$132.6

$129.1

5 .0%

Binghamton, NY

$96.9

$111.2

$109.7

$105.8

$110.3

0 .5%

Birmingham-Hoover, AL

$165.1

$161.3

$153.2

$135.4

$130.4

-14.9%

Bismarck, ND

$134.9

$152.9

$153.4

$164.5

$153.3

-0.1%

Bloomington-Normal, IL

$152.2

$154.0

$150.9

$159.3

$153.8

1 .9%

Boise City-Nampa, ID

N/A

$206.0

$193.4

$168.8

$157.1

-18.8%

Boston-Cambridge-Quincy, MA-NH

$402.2

$395.6

$357.7

$336.0

$290.7

-18.7%

Boulder, CO

$366.4

$376.2

$355.7

$324.7

$328.4

-7.7%

Bridgeport-Stamford-Norwalk, CT

$473.7

$486.6

$439.3

$380.6

$347.4

-20.9%

Buffalo-NiagaraFalls, NY

$97.9

$104.0

$96.6

$106.2

$99.2

2 .7%

Canton-Massillon, OH

$109.3

$110.3

$88.5

$80.4

$66.2

-25.2%

Cape Coral-Fort Myers, FL

$268.2

$252.1

$213.2

$110.9

$87.3

-59.1%

Cedar Rapids, IA

$133.8

$136.2

$129.9

$136.9

$127.3

-2.0%

Champaign-Urbana, IL

$143.0

$144.1

$139.4

$132.0

$141.6

1 .6%

Charleston-North Charleston, SC

$212.4

$215.4

$201.4

$193.8

$188.2

-6.6%

Charleston, WV

$119.4

$122.5

$116.8

$124.7

$119.2

2 .1%

Charlotte-Gastonia-Concord, NC-SC

$190.6

$204.3

$192.7

$186.3

$171.5

-11.0%

Chattanooga, TN-GA

$136.0

$130.9

$125.2

$123.8

$117.9

-5.8%

Chicago-Naperville-Joliet, IL

$273.5

$276.6

$249.6

$217.8

$185.6

-25.6%

Cincinnati-Middletown, OH-KY-IN

$143.2

$140.8

$128.5

$116.0

$106.5

-17.1%

Cleveland-Elyria-Mentor, OH

$134.4

$130.0

$102.1

$88.3

$69.9

-31.5%

ColordoSprings, CO

$218.2

$217.5

$208.9

$187.0

$180.0

-13.8%

Columbia, MO

$139.3

$147.1

$143.9

$138.1

$152.6

6 .0%

Columbia, SC

$141.6

$146.6

$141.6

$139.2

$134.3

-5.2%

Columbus, OH

$148.1

$147.4

$132.0

$126.5

$118.3

-10.4%

CorpusChristi, TX

$131.8

$136.5

$136.8

$134.0

$126.3

-7.7%

Cumberland, MD-WV

$95.7

$109.4

$94.9

$96.9

$114.9

2 1.1%

Dallas-Fort Worth-Arlington, TX

$149.5

$150.9

$142.4

$138.0

$135.7

-4.7%

Danville, IL

N/A

N/A

N/A

N/A

N/A

N/A

Davenport-Moline-Rock Island, IA-IL

$119.7

$108.7

$88.1

$98.1

$100.3

1 3.8%

Dayton, OH

$116.7

$115.6

$100.5

$87.8

$79.7

-20.7%

Decatur, IL

$85.4

$83.1

$79.4

$79.3

$77.1

-2.9%

Deltona-Daytona Beach-Ormond Beach, FL

$205.8

$192.3

$175.6

$143.6

$128.7

-26.7%

Denver-Aurora, CO

$249.5

$245.4

$223.5

$200.8

$192.9

-13.7%

Des Moines, IA

$145.1

$149.2

$147.9

$149.7

$137.3

-7.2%

Detroit-Warren-Livonia, MI

$151.7

$140.3

N/A

N/A

N/A

N/A

Dover, DE

$208.0

$207.5

$199.1

$212.4

$201.0

1 .0%

Durham, NC

$172.8

$178.4

$178.2

$165.6

$171.5

-3.8%

Elmira, NY

$86.8

$81.6

$82.4

$80.9

$77.1

-6.4%

ElPaso, TX

$127.6

$131.9

$133.9

$140.7

$132.8

-0.8%

Erie, PA

$101.3

$98.1

$96.6

$95.2

$85.9

-11.1%

Eugene-Springfield, OR

$230.6

$239.6

$227.5

$212.8

$210.8

-7.3%

Fargo, ND-MN

$136.5

$140.9

$136.9

$140.1

$134.1

-2.0%

Farmington, NM

$172.3

$191.1

$189.9

$184.9

$191.2

0 .7%

Florence, SC

$119.5

$124.2

$116.9

$119.1

$98.5

-15.7%

Ft. Wayne, IN

$99.7

$97.1

$88.7

$88.6

$80.6

-9.1%

Gainesville, FL

$213.2

$211.1

$188.3

$174.0

$160.3

-14.9%

Gary-Hammond, IN

$128.1

$134.2

$124.0

$115.1

$92.0

-25.8%

GlensFalls, NY

$161.6

$167.6

$163.1

$147.6

$156.6

-4.0%

GrandRapids, MI

$134.5

$129.4

$102.8

$80.5

$72.0

-30.0%

GreenBay, WI

$151.3

$150.7

$137.0

$146.6

$138.4

1 .0%

Greensboro-HighPoint, NC

$149.4

$152.0

$142.3

$135.4

$129.7

-8.9%

Greenville, SC

$152.0

$153.6

$154.5

$146.9

$142.0

-8.1%

Gulfport-Biloxi, MS

$145.8

$154.5

$139.0

$129.5

$132.8

-4.5%

Hagerstown-Martinsburg, MD-WV

$223.1

$208.5

$192.7

$171.4

$167.1

-13.3%

Hartford-West Hartford-East Hartford, CT

$258.1

$263.2

$247.3

$233.7

$222.3

-10.1%

Honolulu, HI

$630.0

$643.5

$620.0

$610.0

$570.0

-8.1%

Houston-Baytown-SugarLand, TX

$149.1

$152.5

$148.4

$142.1

$138.5

-6.7%

Indianapolis, IN

$119.3

$120.5

$107.3

$100.2

$94.6

-11.8%

Jackson, MS

$147.1

$139.0

$123.6

$126.6

$122.6

-0.8%

Jacksonville, FL

$193.0

$189.2

$185.7

$160.7

$154.1

-17.0%

Kalamazoo-Portage, MI

N/A

N/A

N/A

N/A

N/A

N/ A

Kankakee-Bradley, IL

$131.5

$134.5

$119.3

$125.6

$116.6

-2.3%

KansasCity, MO-KS

$155.8

$153.3

$139.5

$131.0

$126.6

-9.2%

Kennewick-Richland-Pasco, WA

$156.1

$169.2

$163.7

$165.9

$159.3

-2.7%

Kingston, NY

$252.7

$258.4

$237.8

$224.0

$194.3

-18.3%

Knoxville, TN

$151.2

$156.4

$146.0

$141.7

$138.6

-5.1%

Lansing-E.Lansing, MI

$137.7

$126.8

$92.5

$80.0

$65.6

-29.1%

LasVegas-Paradise, NV

$317.4

$297.7

$247.6

$181.7

$155.3

-37.3%

Lexington-Fayette, KY

$147.8

$147.5

$138.9

$138.2

$133.8

-3.7%

Lincoln, NE

$137.5

$137.5

$134.0

$133.1

$132.4

-1.2%

Little Rock-N.LittleRock, AR

$127.0

$129.1

$127.2

$125.2

$125.4

-1.4%

Los Angeles-Long Beach-Santa Ana, CA

$584.8

$593.6

$460.5

$354.3

$303.5

-34.1%

Louisville, KY-IN

$137.6

$137.4

$131.6

$124.0

$121.1

-8.0%

Madison, WI

$223.2

$226.5

$217.1

$227.0

$208.5

-4.0%

Manchester-Nashua, NH

N/A

N/A

$245.1

$238.6

$215.7

-12.0%

Memphis, TN-MS-AR

$142.3

$137.2

$110.8

$100.2

$96.1

-13.3%

Miami-Fort Lauderdale-Miami Beach, FL

$371.2

$365.5

$319.1

$234.2

$206.0

-35.4%

Milwaukee-Waukesha-West Allis, WI

$220.9

$223.4

$204.4

$194.9

$201.5

-1.4%

Minneapolis-St.Paul-Bloomington, MN-WI

$232.3

$225.2

$199.9

$188.6

$174.1

-12.9%

Mobile, AL

$137.0

$136.4

$129.9

$125.0

$127.9

-1.5%

Montgomery, AL

$144.2

$143.8

$133.7

$126.3

$122.5

-8.4%

Nashville-Davidson–Murfreesboro, TN

N/A

N/A

N/A

N/A

N/A

N/ A

New Haven-Milford, CT

$287.7

$286.5

$255.5

$240.4

$216.5

-15.3%

New Orleans-Metairie-Kenner, LA

$173.1

$160.3

$157.1

$154.9

$150.8

-4.0%

New York-N. NJ-Long Island, NY-NJ-PA

$469.3

$469.7

$445.8

$391.4

$374.5

-16.0%

New York-Wayne-White Plains, NY-NJ

$539.4

$540.3

$492.8

$459.2

$429.9

-12.8%

NY:Edison, NJ

$387.7

$380.3

$361.8

$344.0

$320.9

-11.3%

NY:Nassau-Suffolk, NY

$474.7

$477.2

$462.8

$382.1

$376.7

-18.6%

NY:Newark-Union, NJ-PA

$433.0

$443.7

$409.4

$374.4

$358.2

-12.5%

Norwich-New London, CT

$264.0

$267.7

$244.9

$223.1

$199.6

-18.5%

Ocala, FL

$165.8

$164.6

$145.5

$121.7

$108.6

-25.4%

Oklahoma City, OK

$125.0

$134.9

$124.9

$124.2

$129.9

4 .0%

Omaha, NE-IA

$138.4

$138.0

$132.9

$129.7

$129.0

-2.9%

Orlando, FL

$270.4

$261.3

$232.0

$175.2

$154.8

-33.3%

Palm Bay-Melbourne-Titusville, FL

$212.0

$183.6

$158.8

$123.6

$114.3

-28.0%

Pensacola-FerryPass-Brent, FL

$166.0

$165.6

$156.3

$151.7

$137.2

-12.2%

Peoria, IL

$112.7

$118.6

$119.0

$117.2

$109.8

-7.7%

Philadelphia-Camden-Wilmington, PA-NJ-DE-MD

$230.2

$234.9

$220.9

$212.5

$206.0

-6.7%

Phoenix-Mesa-Scottsdale, AZ

$268.2

$257.4

$222.2

$155.9

$129.2

-41.9%

Pittsburgh, PA

$116.1

$120.7

$111.6

$109.1

$103.4

-7.3%

Pittsfield, MA

$212.9

$217.4

$216.6

$206.0

$180.0

-16.9%

Portland-South Portland-Biddeford, ME

$243.8

$242.7

$234.0

$214.5

$192.1

-17.9%

Portland-Vancouver-Beaverton, OR-WA

$280.8

$295.2

$286.6

$264.5

$248.6

-13.3%

Providence-New Bedford-Fall River, RI-MA

$289.6

$286.5

$262.9

$224.5

$202.4

-23.0%

Raleigh-Cary, NC

$213.8

$224.2

$228.1

$230.9

$223.0

-2.2%

Reading, PA

$143.2

$154.7

$148.4

$155.1

$145.2

-2.2%

Reno-Sparks, NV

$347.2

$321.4

$283.7

$231.2

$209.8

-26.0%

Richmond, VA

$225.5

$233.7

$219.1

$199.4

N/A

N/ A

Riverside-San Bernardino-Ontario, CA

$400.7

$379.5

$287.1

$201.3

$172.5

-39.9%

Rochester, NY

$114.8

$117.9

$108.5

$112.5

$105.6

-2.7%

Rockford, IL

$119.3

$119.3

$115.2

$111.5

$100.0

-13.2%

Sacramento–Arden-Arcade–Roseville, CA

$374.5

$342.8

$258.5

$187.9

$169.3

-34.5%

Saginaw-Saginaw Township North, MI

N/A

$82.1

$65.4

$43.9

$30.3

-53.7%

Saint Louis, MO-IL

$148.4

$145.4

$121.4

$113.7

$100.9

-16.9%

Salem, OR

$212.9

$228.3

$218.5

$198.0

$200.0

-8.5%

SaltLakeCity, UT

$203.0

$232.0

$225.7

$225.4

$230.1

1 .9%

SanAntonio, TX

$141.7

$153.2

$149.8

$143.4

$148.3

-1.0%

San Diego-Carlsbad-San Marcos, CA

$601.8

$588.7

$459.0

$332.8

$323.2

-29.6%

San Francisco-Oakland-Fremont, CA

$752.8

$804.8

$701.7

$487.1

$402.0

-42.7%

San Jose-Sunnyvale-Santa Clara, CA

$775.0

$836.8

$780.0

$525.0

$450.0

-42.3%

Sarasota-Bradenton-Venice, FL

$334.3

$310.9

$262.3

$178.1

$155.2

-40.8%

Seattle-Tacoma-Bellevue, WA

$361.2

$386.9

$372.3

$325.9

$315.2

-15.3%

Shreveport-BossierCity, LA

$132.2

$135.6

$131.5

$139.2

$136.0

3 .4%

SiouxFalls, SD

$138.0

$144.5

$136.0

$142.4

$95.5

-29.8%

SouthBend-Mishawaka, IN

$92.7

$90.7

$80.9

$80.8

$61.8

-23.6%

Spartanburg, SC

$126.7

$128.6

$130.3

$120.8

$109.1

-16.3%

Spokane, WA

$184.1

$193.8

$185.0

$185.9

$180.0

-2.7%

Springfield, IL

$105.4

$109.0

$107.2

$96.7

$111.4

3 .9%

Springfield, MA

$209.6

$211.9

$198.1

$186.4

$170.1

-14.1%

Springfield, MO

$124.8

$122.6

$120.9

$117.1

$116.3

-3.8%

Syracuse, NY

$116.8

$121.8

$110.3

$114.1

$113.7

3 .1%

Tallahassee, FL

$177.5

$179.5

$173.3

$150.1

$156.0

-10.0%

Tampa-St.Petersburg-Clearwater, FL

$228.9

$214.9

$184.7

$151.5

$135.3

-26.7%

Toledo, OH

$110.0

$106.6

$89.7

$75.6

$65.5

-27.0%

Topeka, KS

$106.1

$111.9

$103.3

$104.8

$106.5

3 .1%

Trenton-Ewing, NJ

$289.6

$307.1

$288.2

$247.8

$252.5

-12.4%

Tucson, AZ

$244.9

$244.8

$221.0

$185.9

$176.4

-20.2%

Tulsa, OK

N/A

N/A

$122.2

N/A

N/A

N/A

Virginia Beach-Norfolk-Newport News, VA-NC

$216.0

$226.8

$219.0

$210.0

$201.0

-8.2%

Washington-Arl.-Alexandria, DC-VA-MD-WV

$431.0

$430.8

$372.5

$295.1

$279.4

-25.0%

Waterloo/Cedar Falls, IA

$108.9

$112.8

$104.0

$105.2

$97.3

-6.4%

Wichita, KS

$114.9

$115.6

$112.7

$118.2

$108.7

-3.5%

Worcester, MA

$281.7

$274.6

$248.2

$217.0

$189.6

-23.6%

Yakima, WA

$136.5

$156.5

$148.4

$145.9

$143.5

-3.3%

Youngstown-Warren-Boardman, OH-PA

$81.5

$78.9

$67.7

$61.7

$51.2

-24.4%

N/A-not available
Source: National Association of Realtors


Developers trim prices to keep baby boom buyers in the market

Wednesday, May 13th, 2009

Builders are willing to cut profits to attract customers with assets

Derrick Penner
Sun

Qualicum Landing hoped to sell three-bedroom houses like this in its development in Vancouver Island’s Qualicum Beach for $ 549,000. It’s now marketing them for $ 399,000.

David Baxter, director of the Urban Futures Institute in Vancouver.

David kSteele, a partner in Qualicum Landing Developments.

As home prices and retirement investments take a dive across North America, housing developers are changing strategies just to stay in the game.

Vancouver Island developer Dave Steele and his partners are betting that by making a dramatic shift in their expectations for a 62-unit, beachfront, resort-style project near Qualicum Beach, they’ll be able to build some houses while others have stopped.

“Our philosophy is that we want to be there,” Steele, a partner in Qualicum Landing Developments Ltd., said in an interview, to catch a slice of the demographic trend that is seeing nearly 10 million Canadians (some 1.3 million of them British Columbians) roll toward retirement.

However, to “be there” in the current market means squeezing margins and exploiting the more competitive market for construction trades to reduce prices on the initial phase of the project some 27 per cent from when the firm first drew up its plans two years ago.

Qualicum Landing is now marketing three-bedroom houses for $399,000. It originally hoped to sell them at $549,000. Larger two-bedroom-and-den houses with garages — with initial prices penciled in at $679,000 — are being marketed for $499,000.

“Obviously the economics aren’t as good as they were two or three years ago,” Steele said, but their hope is that setting lower prices now will secure a spot in the market and they’ll make up some of that margin in future phases once property values start rising.

The Parksville Qualicum area, like other parts of the province, has seen its sales fall, prices drop and builders put projects on hiatus.

Realtors sold 41 homes in March, as recorded through the Multiple Listing Service, down two per cent from the same month a year ago. That followed from February, which saw the region rack up 25 sales, a one-third drop from the same month a year ago.

Jim Hoffman, director for Parksville-Qualicum on the Vancouver Island Real Estate Board, said that the market seems stable after a slow, snowy winter, but inventories keep rising.

Sales in the Parksville-Qualicum area, while slower than the previous year, started off more briskly than Hoffman expected this spring.

“Buyers are in control, and they’re going to pick and choose,” Hoffman said, which he expects will result in further “very slight” price decreases for the balance of 2009.

Alberta buyers “with a pocket full of oil money” are not a big part of the market now, Hoffman said, because they are having a tough time selling their existing homes.

“It seems to be getting back to a regular market before the boom.”

Real estate markets have come off of their peaks, but people can’t just focus on the downside of the correction, David Baxter, an economist and demographer with the Vancouver-based Urban Futures Institute, said in an interview.

In a crisis, such as the world financial crisis that erupted last fall, he added, people tend to think the crisis “is going to be forever.”

“Yeah, people lose sight of where we’re going,” Baxter said, which is towards a long wave of baby boomers washing ashore on the beach of retirement and a continually growing population through immigration.

That, Baxter added, will be the core of housing demand into the future. And despite the recent financial meltdown that saw the collapse of stock markets wipe out investments gains for many, he said most of the boomers closest to retirement will likely still be okay.

“The big thing is changed expectations,” Baxter said. “Certainly, again, there are specific individuals who are taking a big hit because of the way their investment portfolios were structured.”

“That will change how they conduct themselves in the future. It will be probably not what they’d wished, but probably what a long-term trend line said you were going to get.”

Boomers, particularly those born between 1949 and 1953 — of which there are almost 2.2 million (300,800 in B.C.) — own almost all the equity in their homes.

“I can’t give you the strong ‘this is the boomer demographic to go after,’ ” Baxter added, “except to say it’s certainly there, and they have coin.”

The peak of the boom — the nearly 2.8 million (almost 362,000 in B.C.) — were born between 1959 and 1963.

The difficulty, Baxter said, is that boomers who will remain healthier for longer than their parents, will be more likely to be capable of maintaining their existing homes and less likely to move to retirement retreats.

“What we do find, though, is that people will move as a lifestyle choice,” Baxter said, “not as an imperative.”

And many in the leading edge, Baxter added, will be the boomers who bought homes a long time ago and have not been affected by the paper gains and losses of the latest real estate boom and subsequent correction.

“There certainly is a segment of the market that will move on a discretionary basis,” Baxter said. “And if somebody taps into that, it can be huge for them.”

© Copyright (c) The Vancouver Sun

Splendour on the roof

Tuesday, May 12th, 2009

Other

Download Document