Archive for August, 2009

Homeowners can show their hearts with Games rentals

Wednesday, August 12th, 2009

Program enables homeowners to share rental income with charities for homeless

Jeff Lee
Sun

Two Vancouver charities that help the homeless will be the beneficiaries of a unique program to match visitors to the Vancouver 2010 Olympics with home-stay accommodation.

In what is being called an Olympic first, Covenant House and the Streetohome Foundation will share revenues with homeowners with a conscience who want to rent out beds, rooms or even houses to Games-time visitors.

Today, the founders of the Web-based accommodation-matching service will kick off their plan to try to raise thousands of dollars for the two charities by capitalizing on the demand for visitor accommodation during the Games.

The non-profit project has the support and backing of the Vancouver Organizing Committee, but the group isn’t using any of the Olympic marks or logos.

“We’re a collective of people who were very concerned about creating a social opportunity to benefit from the Olympics,” said Tracey Axelsson, project manager for Home For The Games. “We want a thousand people to do this, and the benefits will go to helping the homeless.”

The idea was the brainchild of Charles Montgomery and several others who gathered up several corporate sponsorships and $150,000 in in-kind donations to get the website operating. Their idea calls for people who want to rent out rooms for the Games to list their facilities on the website, www.homeforthegames.com.

Volunteers will vet each listing to make sure the rooms actually exist and meet minimum safety standards, Axelsson said.

When people book accommodation, they have to leave with the society a down payment of half the amount. That portion is then given to Covenant House and Streetohome Foundation, which in turn will issue tax receipts. The homeowner retains the rest.

The society’s website was soft-launched Tuesday. It doesn’t yet list any beds, but Axelsson said it has already received a number of applications, as well as one online donation.

“This is such a wonderful idea,” said Jae Kim, president of Streetohome, which provides funding programs to homeless shelters.

“When you think about people who have a home using their revenue not to make a quick buck during the Olympics but to help people who are homeless, I think there is something poetic about that.

“We thought it was a very interesting way to leverage what is going on with the city in terms of homelessness.”

Kim said she didn’t know how much money the program will raise for Streetohome, but said none will go to cover administrative expenses. Axelsson said Home For The Games worked directly with Vanoc’s sustainability department.

© Copyright (c) The Vancouver Sun

City mulls housing development near Canada Line station

Wednesday, August 12th, 2009

Councillor notes development opportunities around transit system

Cheryl Rossi
Van. Courier

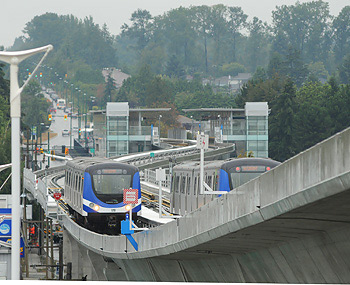
Developers hope to build on a 4.8-acre site that includes the new rapid transit line station and a bus loop between Cambie, Yukon and Southwest Marine Drive. Photograph by : Dan Toulgoet

Staff recommended against it, but city council unanimously supported a review of potential housing on industrial land adjacent to the new Canada Line station at Southwest Marine Drive, July 28.

Council also asked staff to report back on encouraging green and creative industries in this industrial zone.

In April, PCI Group and architects Busby, Perkins and Will submitted a rezoning application for a 4.8-acre site that includes the new rapid transit line station and a bus loop between Cambie, Yukon and Southwest Marine Drive.

The companies propose market housing snug to the Canada Line station, an office building close to the bus loop and, potentially, a 23-storey tower containing 245 units of rental housing, a movie theatre, fitness centre and daycare. They say the offices, stores and other retail outlets there would create approximately 2,300 new jobs.

One of the touted benefits was more eyes on transit hubs.

But a city staff report states industrial land prices in Vancouver are the most expensive in the region due to limited land supply and a high demand for locations with easy access to customers, suppliers and workers. Since 1968, Vancouver’s industrially zoned land has been reduced from 2,400 acres to 1,677 acres.

Brent Toderian, the city’s director of planning, told the Courier in April that residential land generally has four times the value of commercial land, let alone industrial, so he was worried perceived support of residential use would spur land speculation.

Vision Coun. Raymond Louie, who forwarded the recommendation about reviewing housing opportunities at 8430 Cambie St., said the city has made it clear to speculators that the only piece of property where residential would be considered is the chunk with the rapid transit station and bus loop.

“It was important for us to take advantage of the $2 billion investment of the Canada Line, that we look to every opportunity to build complete communities where there would be opportunities to live and work and for the creation of [housing] affordability within the area as well,” he said.

Louie also forwarded a motion requesting staff to explore green and creative industrial uses, which was promoted by Vision Mayor Gregor Robertson.

Otherwise, council confirmed the importance of retaining existing industrial land in South Vancouver and supporting job intensive uses.

The industrial lands appear to be underutilized at this point. But the staff report states structural shifts in the economy have seen the closure of large-scale operations in the area, particularly those associated with the forestry sector.

“In some cases, the owners of these sites have been awaiting a planning policy review prior to making future plans for their sites,” the report says.

Council also supported staff’s recommendation to work with the local community and business owners to enhance public access to the Fraser River waterfront while balancing the needs of industry.

Louie said possible future residents would need to know that despite potential odours and noise, industry comes first.

Staff is expected to report back to council on new industrial land uses in six months.

© Vancouver Courier 2009

Bankruptcies soar in June

Wednesday, August 12th, 2009

‘Business appears to have anticipated the coming trouble’

Province

The financial health of many B.C. consumers continued to deteriorate in June as personal bankruptcies across the province surged 73.4 per cent from the same month a year earlier.

B.C. saw a total of 947 consumer bankruptcies filed in June, up from 546 in June 2008, the federal Office of the Superintendent of Bankruptcy said yesterday.

B.C. businesses fared better, with 47 business bankruptcies in June, up 42.4 per cent from a year earlier.

Across Canada, personal bankruptcies jumped 54.3 per cent in June compared with a year earlier. A total of 10,823 consumer bankruptcies were filed that month, up from 7,012 in June 2008, the superintendent of bankruptcy said.

For business, the hit was much lower, with 515 business bankruptcies in June, a 10.8-per-cent hike from the 465 of June 2008. But that doesn’t mean businesses escaped unscathed. June marked the first time since January that year-over-year business bankruptcies recorded an increase — May alone posted a 16.2-per-cent decrease compared with the previous year.

“Because Canada fell into recession a bit later than the U.S., Canadian business appears to have anticipated some of the coming trouble,” CIBC chief economist Avery Shenfeld said. “This does appear to be the first month where we are starting to see a bit of a year-over-year upturn. But still, it’s been very tame, actually.”

Sal Guatieri, senior economist with BMO Capital Markets, also saw the numbers as largely encouraging, calling Canadian business performance “remarkable.”

“It is a pretty sharp upward trend, but it’s not too surprising given what’s happened to the labour market,” Guatieri said. “The rate of business bankruptcy is still very low in Canada. That’s generally a reflection of much stronger balance sheets for businesses than households.

Total bankruptcies were up 51.6 per cent to 11,338 in June from 7,478 a year earlier. Retail, construction and manufacturing posted the most new bankruptcies.

“These numbers have been trending a bit higher than some past recessions given the heavy use of credit in the good times,” said Shenfeld. “I think the difference here is that the consumer sector took on a lot of debt prior to the recession and, with the sharp rise in unemployment, is having trouble paying for it.”

© Copyright (c) The Province

Median home price rises as sales pick up; 155 metro areas

Wednesday, August 12th, 2009

Alan Zibel, AP Real Estate Writer
USA Today

Christopher Paulsen, left, decided to rent out a room in his house to recent college grad Ben Storrud after his son moved out of their Incline Village, Nev. home. Nevada had one of the highest housing price declines in the country in the second quarter. By Scott Sady, AP

WASHINGTON A real estate group says home sales and prices posted gains in the second quarter, another sign that the ailing housing market is finally coming to life.

The National Association of Realtors says the median sale price in the quarter was $174,100, up 4% from the first quarter, but still almost 16% below a year ago.

Prices were down from a year ago in 129 of 155 metropolitan areas the group tracks. Thirty-nine states experienced sales increases from the first quarter and nine states were higher than a year ago.

Sales rose to a seasonally adjusted annual rate of 4.76 million, from 4.58 million in the first quarter, but were still about 3% below a year ago.

According to Lawrence Yun, NAR chief economist, the areas with the largest price declines were those with the most foreclosures.

The biggest drop, nearly 53%, was in Fort Myers, Fla. Prices also fell 35% or more in Phoenix, Riverside, Calif. and Las Vegas. The biggest price gain, nearly 31%, was in Davenport, Iowa, followed by Cumberland, Md., at nearly 22%.

Yun said the sales gain appears to be sustainable. “With low interest rates, lower home prices and a first-time buyer tax credit, we’ve been seeing healthy increases in home sales, which are a hopeful sign for the economy,” he said.

Yun said on average each home sale pumps an additional $63,000 into the economy because it generates demand for related goods and services.

Median sale prices in 155 metro areas

Metropolitan Area

Q2 2008

Q1 2009

Q2 2009

Change from Q2 2008


Akron, OH

$106.500

$50.100

$88.000

-17.4%


Albany-Schenectady-Troy, NY

$198.400

$184.500

$189.400

-4.5%


Albuquerque, NM

$199.400

$182.600

$182.200

-8.6%


Allentown-Bethlehem-Easton, PA-NJ

$251.500

$218.000

$225.600

-10.3%


Amarillo, TX

$124.600

$122.000

$127.300

2.2%


Anaheim-Santa Ana, CA (Orange Co.)

$578.000

$435.800

$468.100

-19.0%


Appleton, WI

$134.900

$110.300

$113.900

-15.6%


Atlanta-Sandy Springs-Marietta, GA

$158.300

$115.600

$121.400

-23.3%


Atlantic City, NJ

$255.900

$219.100

$218.700

-14.5%


Austin-Round Rock, TX

$194.200

$182.300

$194.000

-0.1%


Baltimore-Towson, MD

$280.500

$245.800

$253.000

-9.8%


Barnstable Town, MA

$350.200

$276.700

$325.600

-7.0%


Baton Rouge, LA

$165.700

$159.400

$168.500

1.7%


Beaumont-Port Arthur, TX

$124.900

$129.100

$138.600

11.0%


Binghamton, NY

$120.900

$110.300

$117.700

-2.6%


Birmingham-Hoover, AL

$163.500

$130.400

$152.300

-6.9%


Bismarck, ND

$152.500

$153.300

$157.800

3.5%


Bloomington-Normal, IL

$152.800

$153.800

$153.000

0.1%


Boise City-Nampa, ID

$191.000

$157.100

$160.400

-16.0%


Boston-Cambridge-Quincy, MA-NH**

$366.700

$290.700

$336.100

-8.3%


Boulder, CO

$375.800

$328.400

$373.300

-0.7%


Bridgeport-Stamford-Norwalk, CT

$449.900

$347.400

$442.900

-1.6%


Buffalo-Niagara Falls, NY

$108.200

$99.200

$115.400

6.7%


Canton-Massillon, OH

$102.800

$66.200

$101.500

-1.3%


Cape Coral-Fort Myers, FL

$178.100

$87.300

$84.000

-52.8%


Cedar Rapids, IA

$141.200

$127.300

$141.700

0.4%


Champaign-Urbana, IL

$142.900

$141.600

$141.000

-1.3%


Charleston-North Charleston, SC

$215.100

$188.200

$198.200

-7.9%


Charleston, WV

$136.600

$119.200

$131.200

-4.0%


Charlotte-Gastonia-Concord, NC-SC

$201.300

$171.500

$199.700

-0.8%


Chattanooga, TN-GA

$132.400

$117.900

$125.700

-5.1%


Chicago-Naperville-Joliet, IL

$257.600

$185.600

$204.300

-20.7%


Cincinnati-Middletown, OH-KY-IN

$139.500

$106.500

$129.600

-7.1%


Cleveland-Elyria-Mentor, OH

$117.500

$69.900

$106.000

-9.8%


Colordo Springs, CO

$214.700

$180.000

$189.000

-12.0%


Columbia, MO

$146.500

$152.600

$144.300

-1.5%


Columbia, SC

$149.500

$134.300

$137.900

-7.8%


Columbus, OH

$145.700

$118.300

$136.600

-6.2%


Corpus Christi, TX

$144.400

$126.300

$133.400

-7.6%


Cumberland, MD-WV

$101.500

$114.900

$123.500

21.7%


Dallas-Fort Worth-Arlington, TX

$151.000

$135.700

$150.700

-0.2%


Danville, IL

N/A

N/A

N/A

N/A


Davenport-Moline-Rock Island, IA-IL

$86.700

$100.300

$113.200

30.6%


Dayton, OH

$116.900

$79.700

$106.500

-8.9%


Decatur, IL

$94.200

$77.100

$91.300

-3.1%


Deltona-Daytona Beach-Ormond Beach, FL

$173.400

$128.700

$127.200

-26.6%


Denver-Aurora, CO

$225.200

$192.900

$223.700

-0.7%


Des Moines, IA

$156.600

$137.300

$150.100

-4.2%


Detroit-Warren-Livonia, MI

N/A

N/A

N/A

N/A


Dover, DE

$202.600

$201.000

$193.700

-4.4%


Durham, NC

$185.900

$171.500

$185.500

-0.2%


Elmira, NY

$76.400

$77.100

$85.000

11.3%


El Paso, TX

$137.700

$132.800

$131.800

-4.3%


Erie, PA

$103.900

$85.900

$98.100

-5.6%


Eugene-Springfield, OR

$230.200

$210.800

$202.400

-12.1%


Fargo, ND-MN

$140.200

$134.100

$141.200

0.7%


Farmington, NM

$192.800

$191.200

$188.600

-2.2%


Florence, SC

$114.200

$98.500

$115.500

1.1%


Ft. Wayne, IN

$96.500

$80.600

$94.600

-2.0%


Gainesville, FL

$204.800

$160.300

$178.200

-13.0%


Gary-Hammond, IN

$136.300

$92.000

$115.100

-15.6%


Glens Falls, NY

$167.900

$156.600

$152.400

-9.2%


Grand Rapids, MI

$112.500

$72.000

$86.500

-23.1%


Green Bay, WI

$150.400

$138.400

$141.300

-6.1%


Greensboro-High Point, NC

$153.200

$129.700

$141.800

-7.4%


Greenville, SC

$160.300

$142.000

$140.000

-12.7%


Gulfport-Biloxi, MS

$143.300

$132.800

$138.700

-3.2%


Hagerstown-Martinsburg, MD-WV

$193.100

$167.100

$164.900

-14.6%


Hartford-West Hartford-East Hartford, CT

$253.900

$222.300

$234.100

-7.8%


Honolulu, HI

$636.000

$570.000

$569.500

-10.5%


Houston-Baytown-Sugar Land, TX

$153.400

$138.500

$157.400

2.6%


Indianapolis, IN

$118.400

$94.600

$121.300

2.4%


Jackson, MS

$129.500

$122.600

$140.100

8.2%


Jacksonville, FL

$186.800

$154.100

$152.700

-18.3%


Kalamazoo-Portage, MI

N/A

N/A

N/A

N/A


Kankakee-Bradley, IL

$134.000

$116.600

$132.200

-1.3%


Kansas City, MO-KS

$152.800

$126.600

$144.100

-5.7%


Kennewick-Richland-Pasco, WA

$163.400

$159.300

$163.900

0.3%


Kingston, NY

$252.800

$194.300

$207.000

-18.1%


Knoxville, TN

$153.600

$138.600

$144.700

-5.8%


Lansing-E.Lansing, MI

$108.400

$65.600

$81.200

-25.1%


Las Vegas-Paradise, NV

$235.300

$155.300

$141.800

-39.7%


Lexington-Fayette,KY

$146.800

$133.800

$142.700

-2.8%


Lincoln, NE

$133.500

$132.400

$133.100

-0.3%


Little Rock-N. Little Rock, AR

$133.700

$125.400

$134.600

0.7%


Los Angeles-Long Beach-Santa Ana, CA

$418.900

$303.500

$311.100

-25.7%


Louisville, KY-IN

$134.900

$121.100

$132.700

-1.6%


Madison, WI

$227.400

$208.500

$214.200

-0.06%


Manchester-Nashua, NH

$254.800

$215.700

$222.600

-12.6%


Memphis, TN-MS-AR

$131.600

$96.100

$121.100

-8.0%


Miami-Fort Lauderdale-Miami Beach, FL

$310.200

$206.000

$207.400

-33.1%


Milwaukee-Waukesha-West Allis, WI

$219.900

$190.800

$218.100

-0.8%


Minneapolis-St. Paul-Bloomington, MN-WI

$210.800

$174.100

$184.500

-12.5%


Mobile, AL

$138.900

$127.900

$128.800

-7.3%


Montgomery, AL

$144.200

$122.500

$134.200

-6.9%


Nashville-Davidson–Murfreesboro, TN

N/A

N/A

N/A

N/A


New Haven-Milford, CT

$275.700

$216.500

$236.200

-14.3%


New Orleans-Metairie-Kenner, LA

$162.900

$150.800

$165.800

1.8%


New York-Northern New Jersey-Long Island, NY-NJ-PA

$454.000

$372.900

$379.800

-16.3%


New York-Wayne-White Plains, NY-NJ

$499.400

$423.200

$425.200

-14.9%


NY: Edison, NJ

$373.700

$320.900

$331.700

-11.2%


NY: Nassau-Suffolk, NY

$466.600

$376.700

$386.800

-17.1%


NY: Newark-Union, NJ-PA

$420.200

$350.400

$379.400

-9.7%


Norwich-New London, CT

$241.500

$199.600

$216.200

-10.5%


Ocala, FL

$147.600

$108.600

$110.200

-25.3%


Oklahoma City, OK

$131.000

$129.900

$128.300

-2.1%


Omaha, NE-IA

$138.000

$129.000

$134.900

-2.2%


Orlando, FL

$223.500

$154.800

$149.200

-33.2%


Palm Bay-Melbourne-Titusville, FL

$148.000

$114.300

$104.100

-29.7%


Pensacola-Ferry Pass-Brent, FL

$161.700

$137.200

$147.800

-8.6%


Peoria, IL

$124.800

$109.800

$126.100

1.0%


Philadelphia-Camden-Wilmington, PA-NJ-DE-MD

$235.700

$206.000

$211.000

-10.5%


Phoenix-Mesa-Scottsdale, AZ

$205.100

$129.200

$131.100

-36.1%


Pittsburgh, PA

$125.200

$103.400

$124.200

-0.8%


Pittsfield, MA

$222.900

$180.000

$189.000

-15.2%


Portland-South Portland-Biddeford, ME

$231.000

$192.100

$209.400

-9.4%


Portland-Vancouver-Beaverton, OR-WA

$286.100

$248.600

$246.200

-13.9%


Providence-New Bedford-Fall River, RI-MA

$269.200

$202.400

$215.700

-19.9%


Raleigh-Cary, NC

$213.200

$223.000

$211.300

-0.9%


Reading, PA

$153.600

$145.200

$151.900

-1.1%


Reno-Sparks, NV

$274.400

$209.800

$192.100

-30.0%


Richmond, VA

$239.300

N/A

$211.200

-11.7%


Riverside-San Bernardino-Ontario, CA

$265.200

$172.500

$161.500

-39.1%


Rochester, NY

$119.200

$105.600

$119.100

-0.1%


Rockford, IL

$120.700

$100.000

$113.400

-6.0%


Sacramento–Arden-Arcade–Roseville, CA

$229.500

$169.300

$177.500

-22.7%


Saginaw-Saginaw Township North, MI

$80.300

$30.300

$55.700

-30.6%


Saint Louis, MO-IL

$148.600

$100.900

$133.600

-10.1%


Salem, OR

$216.400

$200.000

$191.200

-11.6%


Salt Lake City, UT

$234.200

$230.100

$216.500

-7.6%


San Antonio, TX

$158.100

$145.200

$153.100

-3.2%


San Diego-Carlsbad-San Marcos, CA

$434.900

$330.500

$347.100

-20.2%


San Francisco-Oakland-Fremont, CA

$684.900

$402.000

$472.900

-31.0%


San JoseSunnyvaleSanta Clara, CA

$755.000

$450.000

$500.000

-33.8%


Sarasota-Bradenton-Venice, FL

$266.400

$155.200

$175.800

-34.0%


Seattle-Tacoma-Bellevue, WA

$380.500

$315.200

$328.400

-13.7%


Shreveport-Bossier City, LA

$142.500

$136.000

$146.800

3.0%


Sioux Falls, SD

$144.400

$95.500

$146.000

1.1%


South Bend-Mishawaka, IN

$89.400

$61.800

$88.100

-1.5%


Spartanburg, SC

$130.200

$109.100

$122.700

-5.8%


Spokane, WA

$196.600

$180.000

$177.800

-9.6%


Springfield, IL

$112.300

$111.400

$116.200

3.5%


Springfield, MA

$209.000

$170.100

$189.500

-9.3%


Springfield, MO

$121.200

$116.300

$120.900

-0.2%


Syracuse, NY

$123.600

$113.700

$124.600

0.8%


Tallahassee, FL

$166.400

$156.000

$149.800

-10.0%


Tampa-St.Petersburg-Clearwater, FL

$180.800

$135.300

$140.900

-22.1%


Toledo, OH

$104.100

$65.500

$87.100

-16.3%


Topeka, KS

$110.300

$106.500

$113.300

2.7%


Trenton-Ewing, NJ

$318.900

$252.500

$254.300

-20.3%


Tucson, AZ

$215.900

$176.400

$174.100

-19.4%


Tulsa, OK

$132.000

$127.000

$133.200

0.9%


Virginia Beach-Norfolk-Newport News, VA-NC

$225.000

$201.000

$216.000

-4.0%


Washington-Arlington-Alexandria, DC-VA-MD-WV

$371.100

$279.400

$319.200

-14.0%


Waterloo/Cedar Falls, IA

$115.400

$97.300

$106.700

-7.5%


Wichita, KS

$125.800

$108.100

$125.300

-0.4%


Worcester, MA

$247.300

$189.600

$220.300

-10.9%


Yakima, WA

$162.300

$143.500

$162.800

0.3%


Youngstown-Warren-Boardman, OH-PA

$71.700

$51.200

$71.500

-0.3%


U.S.

$206.400

$167.300

$174.100

-15.6%


NE

$272.300

$235.200

$246.000

-9.7%


MW

$160.700

$131.600

$146.800

-8.6%


SO

$176.900

$146.600

$158.600

-10.3%


WE

$289.700

$229.200

$212.600

-26.6%


Source: National Association of Realtors


Copyright 2009 The Associated Press. All rights reserved.

Vancouver home prices show steepest drop as prices across Canada fall for ninth straight month

Wednesday, August 12th, 2009

Sun

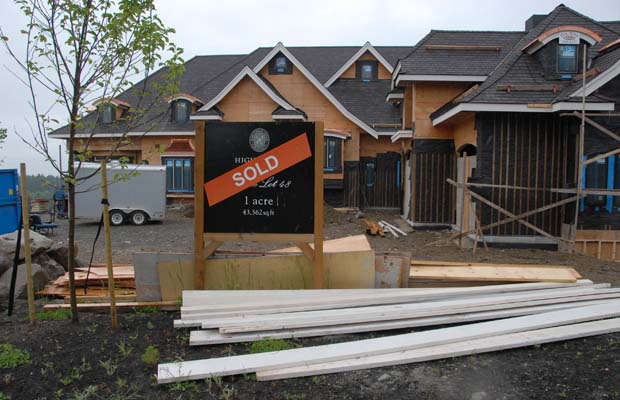
New home prices in Canada fell for the ninth straight month in June. Pictured is High Point equestrian estate community in Langley, B.C. Photograph by: Don MacKinnon, For Canwest News Service

OTTAWA — New home prices in Canada fell for the ninth straight month in June despite predictions the slide would finally come to an end, Statistics Canada said Wednesday.

Prices declined by 0.2 per cent in June, after a 0.1 per cent decline in May, with the decline again the result of falling values in Western Canada.

Economists had forecast prices would remain flat for the month.

“On balance, when combined with the disappointing housing starts report released yesterday, this report provided further confirmation on the dichotomy between the new and existing homes markets in Canada,” said TD Securities economics strategist Millan Mulraine, referring to the fall in July housing starts reported Tuesday by Canada Mortgage and Housing Corporation.

“Indeed, while there is evidence that the existing home market may have stabilized, and is beginning to benefit from increased activity, the same cannot be said for the new home market.”

Vancouver saw the biggest decline, down 0.9 per cent, followed by Edmonton at 0.8 per cent and Victoria at 0.5 per cent.

Despite a rise in the price of some of the most popular model homes in Vancouver, most contractors lowered prices in an effort to stimulate sales and sell off their houses in inventory, the federal agency said.

Lower negotiated prices between contractors and buyers was the reason for the decline in Edmonton, the report noted.

The largest monthly gains were recorded in Saskatoon at 0.5 per cent, followed by 0.4 per cent increases in both Winnipeg and St. John’s, N.L.

Year over year, new home prices were down 3.3 per cent compared with June 2008, the sharpest pace of decline since the early 1990s, Mulraine said.

The largest yearly decline was in Edmonton at 11.7 per cent, followed by Saskatoon at 10.4 per cent and Vancouver at 9.1 per cent.

The largest yearly gains were seen in St. John’s at 10.3 per cent, due to the “continued strength of the local economy.”

Yearly gains were also recorded in Saint John, N.B., Moncton, N.B., Fredericton, Regina and Winnipeg.

Table

Percentage change in new housing prices, May to June 2009

Canada total -0.2

St. John’s +0.4

Charlottetown 0.0

Halifax 0.0

Saint John, Fredericton and Moncton -0.2

Quebec 0.0

Montreal +0.1

OttawaGatineau +0.1

Toronto and Oshawa 0.0

Hamilton 0.1

St. CatharinesNiagara -0.1

London 0.0

Kitchener 0.0

Windsor 0.0

Greater Sudbury and Thunder Bay 0.0

Winnipeg +0.4

Regina 0.0

Saskatoon +0.5

Calgary -0.1

Edmonton -0.8

Vancouver -0.9

Victoria -0.5

Source: Statistics Canada


© Copyright (c) The Vancouver Sun


Homes picture still shaky

Wednesday, August 12th, 2009

Province

Year-to-date housing starts in the Vancouver area have fallen 68 per cent from a year ago as developers tread cautiously around multi-unit projects, Canada Mortgage and Housing Corp. says.

Single-detached starts have been rising since the year began but multi-unit projects are still in retreat, CMHC said yesterday.

“Developers have been taking a wait-and-see approach towards the multi-unit market,” CMHC senior market analyst Robyn Adamache said.

“Homebuilding will remain modest until some of the inventory of new and existing homes is sold off.”

Last month saw foundations being poured for 516 new homes in the Vancouver area, a 73-per-cent drop from July 2008, CMHC said.

Starts across B.C.’s urban centres fell to 10,800 units in July from 12,000 in June, on a seasonally adjusted annual rate, CMHC said.

Nationally, housing dropped unexpectedly in July, falling to an annualized rate of 132,100 in July from 137,800 in June, Canada Mortgage and Housing Corp said yesterday.

“This was a fairly disappointing report, and it suggests that the buoyancy that has been seen in the past two months in this segment of the housing market hasn’t gained much traction, clouding an otherwise positive tone in Canadian housing market activity,”said TD Securities economic strategist Millan Mulraine.

“Even so, our bias remains for increased housing market activity in the near terms as the combination of low mortgage rates, relatively attractive home prices and the various tax incentives continue to spur Canadian housing market activity.”

© Copyright (c) The Province

Harmonized tax badly needed and likely revenue-neutral

Tuesday, August 11th, 2009

Ben Dachis and Alexandre Laurin
Sun

British Columbia has taken a step towards greater prosperity for its citizens with plans to harmonize its seven per cent provincial sales tax (PST) with the federal goods and services tax (GST), creating a single harmonized sales tax (HST) of 12 per cent.

This proposal is primarily an attempt to build a more efficient tax system, and not to increase sales tax revenues. Following Ontario‘s lead, this reform is now needed for B.C.’s economy to remain competitive. The PST — which raises business costs and discourages investment by taxing inputs, often many times before a final sale — is an antiquated tax in today’s world of complex supply chains, and has been abandoned by most economies throughout the world.

GST-type sales taxes are the most efficient way to tax consumption because such taxes effectively strike only once, when something is purchased for final use. The PST, on the other hand, embeds tax at arbitrary rates, depending on how often inputs change hands — about 40 per cent of PST revenue comes from taxing business inputs.

Understandably, the proposal has drawn the ire of those whose products are exempted from the PST but would be subject to HST. But the PST is applied on inputs at multiple stages of production, leading to a cascading — and arbitrary — tax bite hidden in higher consumer prices, including on currently exempted products, such as new houses or restaurant meals. On many products, such as clothing, consumer appliances, automobiles and computers, the effective tax rate is higher than the seven-per-cent PST paid at the cash register. The implementation of the GST itself, and harmonization in the eastern provinces, demonstrated that those prices will fall after the change.

A C.D. Howe Institute study examined the revenue impacts of creating an HST that exactly copied the GST and showed that such a plan would increase provincial revenues. However, there are major differences between what the B.C. government has proposed and the GST. Looking at the details of the B.C. plan shows that harmonization may be very close to revenue-neutral.

First, like the PST, the HST would not apply to gasoline or diesel whereas the GST does. By our estimates, the province left approximately $300 to $400 million per year in the pockets of drivers by maintaining this exemption.

Second, the province is providing a more generous exemption on new housing than the federal government. The GST is partly rebated on the value of new homes below $350,000. Homes above that not only have to pay GST on the value above $350,000 but also have to pay back the rebate on the value of the house below this amount. When Ontario announced it was harmonizing, it initially proposed a similarly awkward new housing rebate.

This created a firestorm of opposition from developers, and Ontario went back to the drawing board.

The new Ontario proposal responded to the concerns raised and now includes the same rebate as B.C. is proposing. Homes below $400,000 would receive a rebate compensating for the HST, and — unlike the GST — the rebate would not be recaptured. Based on estimates for Ontario, we expect this more generous rebate to reduce B.C. HST revenues by about $400 to $500 million per year.

Whether these changes make harmonization exactly revenue neutral depends on how fast, and in what sectors, the economy grows.

But these rebates go most of the way in reducing the tax bite of harmonization.

The HST will significantly lower the cost of investing in B.C., making businesses more competitive, nationally and internationally.

Evidence from numerous studies shows that harmonization raises business investment and that PST-type taxes slow down provincial growth.

Sales tax harmonization is crucial for B.C to maintain its economic competitiveness with Ontario and the rest of the world without significantly increasing taxes.

Ben Dachis and Alexandre Laurin are policy analysts at the C.D. Howe Institute.

© Copyright (c) The Vancouver Sun

Quartz countertops are pricier than granite

Sunday, August 9th, 2009

MIKE HOLMES
Province

Quartz countertops are pricier than granite, but they can be tougher when it comes to stains and scratching and keeping out germs. — CANWEST NEWS SERVICR

The big debate in kitchen renovations these days seems to be granite countertops vs. quartz. I’ve used both and like both.

I like natural products — like hardwood and granite. But there are some huge advantages to using man-made products — like engineered hardwood floors or engineered stone countertops. They are sometimes more durable, easier to maintain or to work with, and are just as beautiful.

Quartz countertops are manmade. They are engineered from a mixture of minerals — mostly but not 100 per cent quartz. The mineral crystals are ground and mixed with resins, bonding agents and colour. Then they’re compressed and heated until solid and impervious to moisture and bacteria.

Basically, what the manufacturers are doing is mimicking nature. Natural granite is a mixture of stone and minerals bound together by the intense pressure and heat deep in the earth.

Quartz is one of the hardest minerals on earth. Natural granite has a percentage of quartz in it, but it’s never as high as the percentage in engineered quartz countertops — which can be as high as 93 per cent. That’s what makes quartz countertops so durable and scratch resistant.

The appearance of your countertop depends on the size of the quartz crystals used — fine crystals will look more uniform than larger ones. And the colour of your counter, since it’s manufactured, will be consistent through the whole countertop. The colour you see on the sample chip is the same as you’ll get in your kitchen.

Every piece of granite, since it’s natural, is unique. Which means the little sample pieces you get to choose from might not represent what your whole counter might look like.

When it comes to choosing between granite and quartz, you need to think about your kitchen design, and your taste. If your countertop is a complex shape and will need lots of pieces and cuts, odds are those seams will be more noticeable in granite than in quartz. Since a granite countertop is a cut slab of rock, it’s not going to be uniform. Quartz will be consistent throughout in pattern and colour, so seams are easier to hide and match.

What I look for in a kitchen counter is that it’s easy to keep clean. You want to make sure it’s non-porous, so bacteria can’t get into it. Some counters I’ve seen are so porous it’s scary: preparing food on them is as unhealthy as wiping your counter with raw chicken.

Quartz countertops are nonporous and impervious to bacteria. That doesn’t mean germs won’t live on the surface — it means they won’t penetrate it.

Granite also needs very little maintenance. Many quartz countertop manufacturers make a big deal about how “porous” and “soft” granite is, in comparison to quartz. It’s a marketing strategy for manufacturers of a competitive product, making it sound like it’s a huge hassle to reseal your granite so consumers might choose something else.

Yes, granite does need to be sealed every year, but it’s not a big deal — it’ll only take an hour or so. It’s not“high-maintenance.”

But for some people any maintenance is too much maintenance. Yes, it’s true, unsealed granite is more porous than quartz, so don’t forget to seal your granite!

Engineered stone countertops are a great product: durable, beautiful and long-lasting. They are heavier than granite and they take highly trained and certified professionals to install them — definitely not a DIY project. And they are expensive — they’re at the upper end of your countertop options. But you get what you pay for.

For more information on home renovations go to makeitright.ca.

Privacy laws are not an excuse to flout Strata Property Act

Sunday, August 9th, 2009

Tony Gioventu
Province

Dear Condo Smarts: I have a dog in a strata in Kitsilano. I bought my unit two years ago, and ever since moving in have been harassed by owners constantly about having a dog, even though the bylaws permit one dog per strata lot.

A group of owners have allegedly complained about the noise my dog makes during the day when I am at work, and council has notified me that I will be fined if I do not get rid of my dog.

My dog goes to work with me every day, so I am challenging their claims. I have requested a hearing as the Act permits, and requested copies of the complaints.

Council claims that due to privacy laws they cannot release the complaints. The Act requires that they identify the particulars of the complaint(s), yet at the hearing they could or would not identify any valid complaint, other than their desire that I remove my dog.

How do I access the complaints if council won’t release them?

If they don’t release them, how do I have any sense they are even valid?

— SJ

Dear SJ: Our offices receive hundreds of calls regarding privacy matters every month. The privacy legislation is not intended to protect strata councils or owners from the requirements of the Strata Act.

The particulars of a complaint can include a number of issues, such as the time and date of the complaints, the duration of the alleged violation and the frequency of the violations.

For strata councils to release complaints, they might insist that they be in writing and that the complainant consent to the release of that information, although it isn’t always that simple.

For example, if an owner notices that someone has made an alteration to common property without written approval and submits a complaint, the council may want to first investigate the claim and photograph the alteration.

Then the complaint itself is no longer necessary.

There may also be concerns about retribution over the complaint or personal security issues.

The strata council will have to decide on the limit of information they can release to both ensure they can prove they have a credible claim and also protect the privacy of owners.

Remember, the council has only informed you of an allegation. They have a duty to provide credible information or evidence proving the allegation, and you still have the option to dispute the claim, or proceed with arbitration or a court action against the strata corporation.

The Office of the Information and Privacy Commissioner has posted a new information guide on privacy matters for strata councils, owners and strata agents. While these are only guidelines, they do provide insight into the complexity of balancing the requirements of the Strata Property Act and the needs of protecting privacy and personal information.

Go to: www.oipc.bc.ca. The guidelines are found under “what’s new.”

Tony Gioventu is executive director of the Condominium Home Owners’ Association. E-mail [email protected]

© Copyright (c) The Province

Lots of potential for Special treatment

Sunday, August 9th, 2009

vancouver specials: Once reviled, these homes are great makeover material

Lena Sin
Province

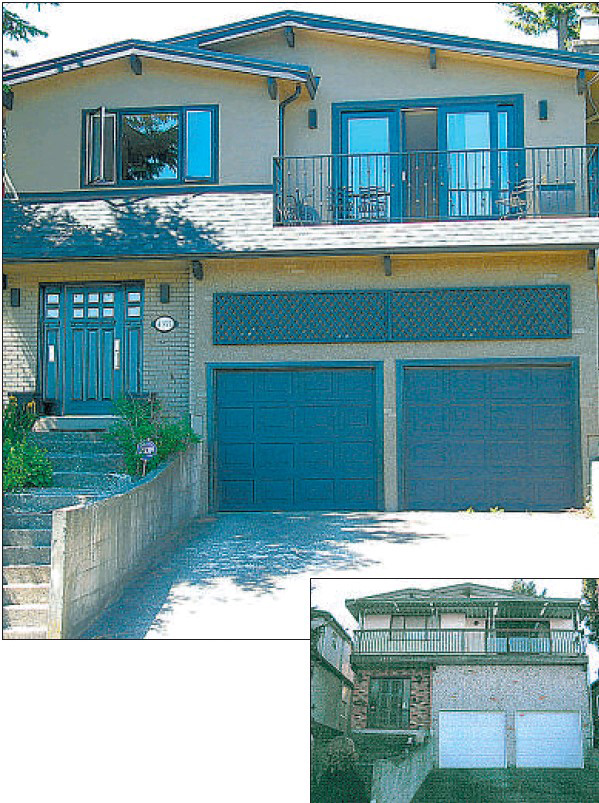
Suzy Hupfau and husband Ian Cumming revamped the exterior of their Vancouver Special (right) by painting, installing graphic new window frames and a matching black door and aluminum railing on the second-floor balcony. – SUBMITTED PHOTOS

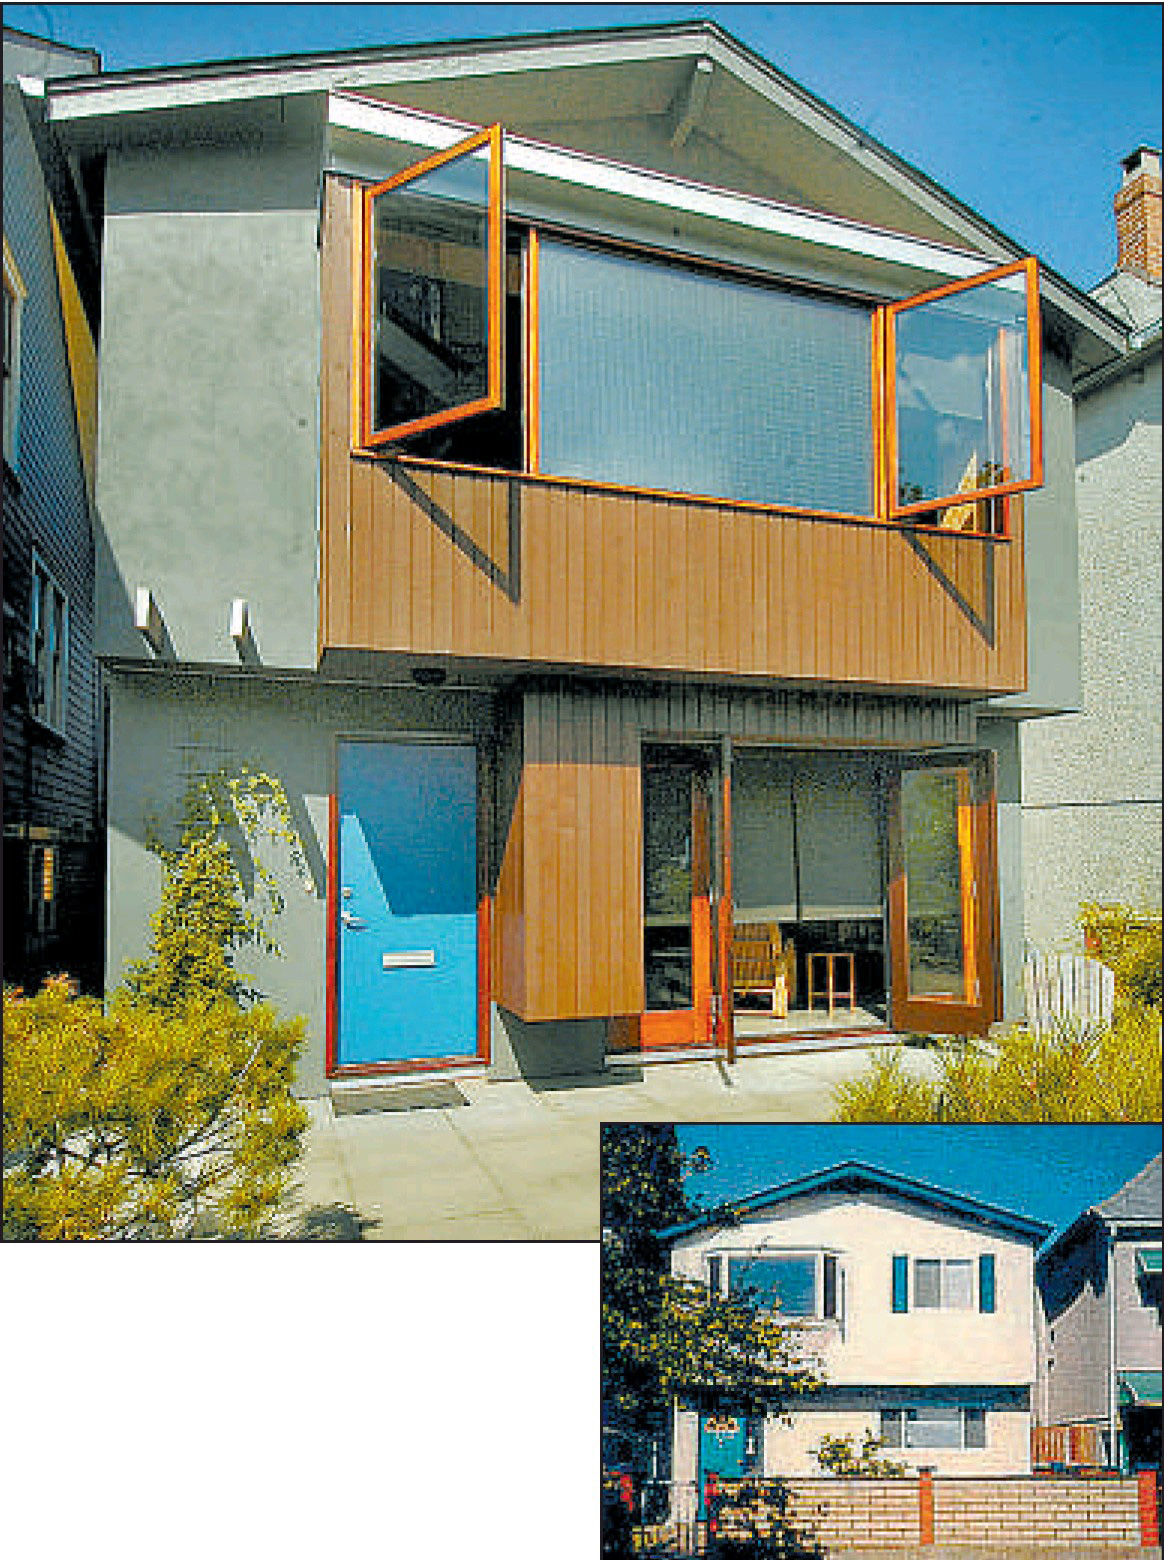
Architect Stephanie Robb made over the exterior of her Vancouver Special (right). It now features a wood-clad bay window that protrudes from the second floor and the ground floor was opened up by installing large, accordioan doors that open onto the patio.

Like many of us, Suzy Hupfau grew up loathing the “Vancouver Special” — that architectural eyesore of brick and stucco and lions on guard. So it was with great disbelief that Hupfau, 35, not only found herself living in one, but the owner of one in the winter of 2005.

“We had huge reservations. Huge, huge reservations. I grew up like everyone else with huge disdain for the Vancouver Special,” says Hupfau.

But like so many young couples struggling to step onto the property ladder, Hupfau and her husband, Ian Cumming, gave up the dream of a pricey Craftsman home and resigned themselves to an eastside Vancouver Special that no one else had even bothered viewing.

And then they hoped to reinvent it — even on a small budget. Cumming, an art director for a video game company, started re-imagining the home with computer sketches and got more ideas from architect and family friend Margot Innes.

A few months later, the couple, working with Tasa Construction, pulled off the transformation by simply painting the exterior, installing graphic new window frames, a matching black door and a new aluminum railing on the second-floor balcony.

They also added a skirt roof over the front door to protect it from the elements. The reno was completed for just $33,000.

“That’s less than a kitchen and we were so pleased with the results,” says Hupfau, who’s now happily committed to the house.

Vancouver architect Stephanie Robb was among the first to champion the Vancouver Special style.

With its clean, boxy shape, Robb says the style can easily be converted into a modern dwelling.

In 1999, she bought an eastside Vancouver Special with the intention of renovating it. But, interestingly enough, the city refused to issue a building permit.

“At the time, the city wasn’t encouraging retention of Vancouver Specials for renovation. They were just hoping they would go away,” says Robb. “They wanted us to tear it down and I flat out said no.”

After 13 months of negotiation, Robb finally got her way and immediately started to transform her Special into an understated, modern home.

The exterior of the house was inspired by mashrabiyas, which are intricately carved, wooden balconies common in Islamic architecture. As such, the dominant feature of the front exterior is a wood-clad bay window that protrudes from the second floor. The ground floor was also opened up by installing large, accordion doors that open onto the patio.

And the front and rear of the house was re-stuccoed and painted a warm grey.

Inside the house, Robb was inspired by cabin living and pared down the interior into an open-plan space with exposed wood framing. The entire renovation cost $125,000 in 2000, although Robb estimates it would cost closer to $400,000 in today’s prices. (To see more photos of Stephanie Robb’s Vancouver Special makeover, visit www.pechetandrobb.com and click on “Lakeview Home” found under the “Buildings” tab.}

For those on a budget, Robb suggests painting the house and investing in a landscape designer to create a very good garden. For more extensive renovations, she suggests hiring a qualified building designer or an architect through the Architectural Institute of B.C.

Elana Zysblat, programming director at the Vancouver Heritage Foundation, is holding a tour of renovated Specials this fall to convince non-believers of their potential.

“We’re strong believers of their contribution to our architectural story. There’s definitely so many of them and they’ve survived the test of time,” says Zysblat.

These working-class homes were initially built to maximize space within the existing building code and were mostly aimed at new immigrants.

But they’re functionality is still clearly relevant today with the focus on green living.

In fact, the Special could be seen as the original “sustainable” home with its large, ground-floor suites capable of housing extended family, laundry lines drawn across the upper deck, or yard used for growing fruits and vegetables.

“It has a lot of elements that can be used in our quest for sustainability,” says Zysblat.

Plus, what could be more green than a makeover in favour of a tear-down? “They have a terrible reputation, but that’s what’s making them turn into a trend. The people who’ve bought Vancouver Specials intentionally are very keen and very inspired and very passionate,” she says.

The Vancouver Heritage Foundation’s tour of Vancouver Specials is on Sept. 26. Look for our preview of the houses on the tour in Sunday Homes on Sept. 20.

© Copyright (c) The Province