Sun
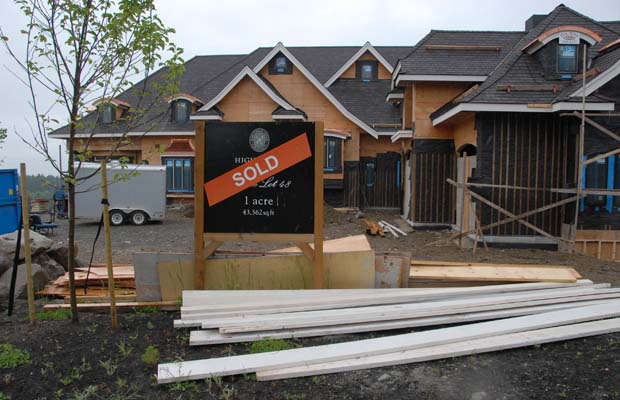
New home prices in Canada fell for the ninth straight month in June. Pictured is High Point equestrian estate community in Langley, B.C. Photograph by: Don MacKinnon, For Canwest News Service
OTTAWA — New home prices in Canada fell for the ninth straight month in June despite predictions the slide would finally come to an end, Statistics Canada said Wednesday.
Prices declined by 0.2 per cent in June, after a 0.1 per cent decline in May, with the decline again the result of falling values in Western Canada.
Economists had forecast prices would remain flat for the month.
“On balance, when combined with the disappointing housing starts report released yesterday, this report provided further confirmation on the dichotomy between the new and existing homes markets in Canada,” said TD Securities economics strategist Millan Mulraine, referring to the fall in July housing starts reported Tuesday by Canada Mortgage and Housing Corporation.
“Indeed, while there is evidence that the existing home market may have stabilized, and is beginning to benefit from increased activity, the same cannot be said for the new home market.”
Vancouver saw the biggest decline, down 0.9 per cent, followed by Edmonton at 0.8 per cent and Victoria at 0.5 per cent.
Despite a rise in the price of some of the most popular model homes in Vancouver, most contractors lowered prices in an effort to stimulate sales and sell off their houses in inventory, the federal agency said.
Lower negotiated prices between contractors and buyers was the reason for the decline in Edmonton, the report noted.
The largest monthly gains were recorded in Saskatoon at 0.5 per cent, followed by 0.4 per cent increases in both Winnipeg and St. John’s, N.L.
Year over year, new home prices were down 3.3 per cent compared with June 2008, the sharpest pace of decline since the early 1990s, Mulraine said.
The largest yearly decline was in Edmonton at 11.7 per cent, followed by Saskatoon at 10.4 per cent and Vancouver at 9.1 per cent.
The largest yearly gains were seen in St. John’s at 10.3 per cent, due to the “continued strength of the local economy.”
Yearly gains were also recorded in Saint John, N.B., Moncton, N.B., Fredericton, Regina and Winnipeg.
Table
Percentage change in new housing prices, May to June 2009
Canada total -0.2
St. John’s +0.4
Charlottetown 0.0
Halifax 0.0
Saint John, Fredericton and Moncton -0.2
Quebec 0.0
Montreal +0.1
Ottawa—Gatineau +0.1
Toronto and Oshawa 0.0
Hamilton 0.1
St. Catharines—Niagara -0.1
London 0.0
Kitchener 0.0
Windsor 0.0
Greater Sudbury and Thunder Bay 0.0
Winnipeg +0.4
Regina 0.0
Saskatoon +0.5
Calgary -0.1
Edmonton -0.8
Vancouver -0.9
Victoria -0.5
Source: Statistics Canada
© Copyright (c) The Vancouver Sun
