Archive for May, 2010

Vancouver prices drive up home index

Thursday, May 13th, 2010

Financial Post
Province

Prices for new homes in Canada rose 0.3 per cent in March, following a 0.1-per-cent increase in February and extending gains that began in July 2009, Statistics Canada reported.

StatsCan said its new-house price index was also up 1.6 per cent in March from a year earlier, compared with an annual increase of 0.9 per cent in February, growth “mostly due to higher prices in Vancouver,” it said.

The new housing price index measures changes over time in the selling prices of new houses.

Higher material costs boosted the index in Montreal and the Ontario cities of Kitchener and London, where prices saw the biggest month-to-month jump.

In Charlottetown and Hamilton, which saw the biggest decreases between March and February, “some builders negotiated lower selling prices,” StatsCan said.

Of the 21 metropolitan regions included in the index, the agency reported that Victoria, Edmonton and Charlottetown were the only ones to report year-over-year declines.

The introduction of a harmonized sales tax on July 1 in Ontario and B.C. could bring the index down in those provinces during the tax-implementation period.

Canada Mortgage and Housing Corp. said home construction rose 1.3 per cent in April as Canada’s real-estate market continued to show signs of recovery.

Housing starts were up by a seasonally adjusted annual rate of 201,700 units last month, up from a revised 199,200 units in March.

© Copyright (c) The Province

60 Minutes Story On Walking Away From Underwater Houses

Thursday, May 13th, 2010

Dan Nunley
Other

The increasing phenomenon of homeowners who can afford to make their mortgage payments but instead are walking away from their house because it has depreciated in value to the point where they owe far more than the house is worth.

More and more homeowners are deciding that it would be folly to continue to make the mortgage payments when they find themselves with a house that is financially underwater.

Here’s a recent video story from 60 Minutes on this very issue.


Watch CBS News Videos Online

Source: CBS News

Home prices could sink without tax credit

Wednesday, May 12th, 2010

Stephanie Armour
USA Today

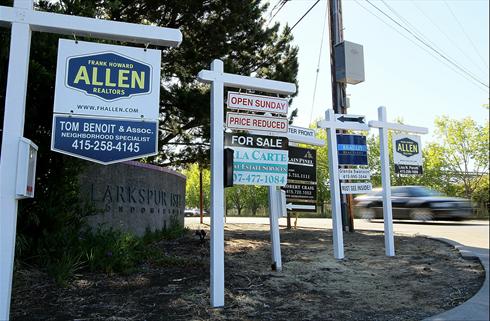
Real estate signs are posted in front of housing development in Larkspur, Calif., in May. By Justin Sullivan, Getty Images

Home prices are widely expected to fall now that a tax credit for home buyers has expired.

That’s raising concern about a possible double dip in home prices.

National housing prices stopped falling early last year and rose 0.3% over the 12 months ending in February, according to a study by real estate analytics firm CoreLogic.

The firm predicts prices will fall this year before starting to rise again in late 2010. Even so, next February’s prices are likely to be 4.2% lower, it forecasts.

“Home prices will struggle for maybe another year,” says Mark Fleming, CoreLogic’s chief economist.

A shrunken pool of buyers due to the tax credit’s expiration is one reason.

“The tax credit is the big reason home prices have been so buoyant, and sales will drop” with its expiration, says Paul Ashworth of Capital Economics. “You will see a double dip in housing prices.”

Another reason is the number of distressed houses — including foreclosures and short sales — that are on the market or that will be in coming months.

Distressed homes, typically sold at discounted prices, accounted for 36% of first-quarter sales, the National Association of Realtors reported Tuesday. The first quarter’s median single-family home price ($166,100) was roughly flat with a year earlier, despite gains in nearly two-thirds of 152 metro areas that the NAR surveys.

The NAR’s survey isn’t the first to show evidence of softening prices. The 20-city Standard & Poor’s/Case-Shiller Home Price Index has fallen for five-consecutive months through February.

“It is too early to say the housing market is recovering,” David Blitzer, chairman of S&P’s index committee, said when the Case-Shiller report for February was released last month.

There may be some good news for sellers in areas not hit so hard by foreclosures. When distressed sales are excluded, CoreLogic’s Home Price Index shows a 4.9% rise in U.S. prices from this February through next February.

While some economists expect home prices to weaken, they don’t expect a major drop.

“I wouldn’t expect anything like the meltdown we’ve had over the past couple years,” says Jay Feldman, senior economist at Credit Suisse.

Copyright 2010 USA TODAY

In-ear headphones offer a serious listening experience

Wednesday, May 12th, 2010

Gillian Shaw
Sun

PowerDuo for iPad, Griffin, $40 US: Available for pre-order now, the PowerDuo combines Griffin’s PowerBlock and Power Jolt for the iPad in a bundled package. Photograph by: Handout, Vancouver Sun

1. JH|10X3 PRO in-ear audio monitors, JHAudio, $800 US

If you’re just looking for an inexpensive pair of earbuds to listen to your iPod on the bus, keep looking. Starting at $800, the JHAudio Pro series is for serious listening. The Pro series custom-fit audio monitors count pros among users — Aerosmith, Guns ‘N Roses, Lady Gaga and others. With noise isolation of up to -26 dB, they reduce background noise, making for better sound without having to crank up the volume to hearing-loss levels. With studies showing hearing can be damaged by intemperate use of headphones (if everyone on the bus can overhear your music, take note) it could be worth the $800 and more for the Pro Series. There are four models, ranging from $800 to $1,150, and they are custom fit for each user. Buyers go to an audiologist who takes an impression of their ear canal, with the mould sent to JH Audio, to create the custom fit. www.jhaudio.com/promusic

2. PowerDuo for iPad, Griffin, $40 US

Available for pre-order now, the PowerDuo combines Griffin’s PowerBlock and Power Jolt for the iPad in a bundled package. With pre-orders for Apple’s new iPad starting May 10 for Canadians and other international buyers, the PowerDuo, expected to be available later this month should be here in time. The PowerBlock AC charger is available for the iPad in a new 2.1-amp capacity. The PowerJolt for on-the-go power is a 12V power adapter. It sells separately for $25; the PowerBlock for $30. www.griffintechnology.com

3. 5D Mark II Digital SLR Camera, Canon, $2,500 US

Not new to the market, but creating a buzz these days for its starring role in the upcoming season finale of House. The entire last episode was shot using Canon’s 5D Mark II, so if you want to see this camera put through its paces, tune in to see it focus on Dr. House, voted the second sexiest TV doctor ever. With a 21.1-megapixel CMOS sensor, it supports Live View shopping and Live View HD videos. It got a resounding 140-character endorsement from Greg Yaitanes, producing director of the show, who tweeted: “i’ll answer any questions you have about the canon 5D that we shot the finale on. yes, a stills camera that shoots amazing HD. go!” www.canon.com

4. System Mechanic, iolo technologies, $40

My hard-worn computer hasn’t actually given up, but there is no doubt it’s getting sluggish. The answer? A little housecleaning with System Mechanic, a virtual tool box that does its job effectively without requiring much effort from the negligent computer owner. Easy to install, it walks you through a few screens assessing and fixing your computer. The verdict on mine wasn’t pretty — 6.6 gigabytes of system clutter, a few (okay more than a few) registry problems, 12 unnecessary startup items. The list went on. I clicked to clean it all up and went back to watching the Canucks beat Los Angeles. Before the game wrapped up, my computer was clean as a whistle. www.iolo.com.

© Copyright (c) The Vancouver Sun

Median home prices up in 60% of cities in 1Q

Tuesday, May 11th, 2010

USA Today

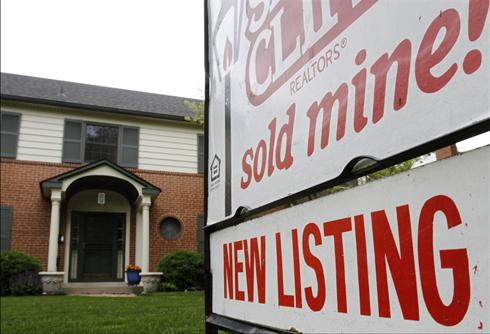
A sold sign is posted outside a home recently listed for sale, in Mariemont, Ohio. By Al Behrman, AP

WASHINGTON (AP) — Home prices rose in nearly 60% of U.S. cities in the first quarter of this year, the National Association of Realtors says.

The median sales price for previously occupied homes rose in 91 out of 152 metropolitan areas tracked in the January-March quarter versus a year ago. There were double-digit price increases in 29 cities.

CHART: Median sales price by metro area

That’s a sharp improvement from the fourth quarter of last year, when prices rose in about 40% of cities. The national median price was $166,100, or 0.7% below the first quarter of last year.

Sales of foreclosures and other distressed properties made up 36% of all sales in the first quarter.

The largest percentage price increase was in Saginaw, Mich., where the median price doubled to nearly $61,000. Prices in Akron, Ohio were up 95% to about $95,000. Prices in Cleveland were up 54% to $106,400.

The largest price decline was in Orlando, where they dropped 15% to nearly $132,000. Prices in Ocala, Fla., fell 14.5% to a median of nearly $93,000. Prices in Cumberland, Md., fell 14.4% to $98,300.

Median sales price of existing single-family homes

Prices are in the thousands and are not seasonally adjusted.


Metropolitan area


2007


2008


2009


2009 Q1


2010 Q1


Change from 09 Q1

Akron, OH

119.3

100.5

93.2

50.1

95.3

90.2%

Albany-Schenectady-Troy, NY

198.9

197.9

189.1

184.5

183.8

-0.4%

Albuquerque, NM

198.5

192.6

180.6

182.6

174.2

-4.6%

Allentown-Bethlehem-Easton, PA-NJ

260.8

243.6

223.4

218.0

228.2

4.7%

Amarillo, TX

118.4

124.7

123.8

122.0

116.8

-4.3%

Anaheim-Santa Ana, CA (Orange Co.)

709.5

533.2

477.2

435.8

486.7

11.7%

Appleton, WI

130

127.4

115.6

110.3

123.0

11.5%

Atlanta-Sandy Springs-Marietta, GA

172

149.5

123.5

115.6

110.1

-4.8%

Atlantic City, NJ

269.7

253.3

221.3

219.1

213.3

-2.6%

Austin-Round Rock, TX

183.7

188.6

187.4

182.2

182.5

0.2%

Baltimore-Towson, MD

286.1

274.1

251.2

245.8

234.9

-4.4%

Barnstable Town, MA

384.7

341.9

321.0

276.7

325.6

17.7%

Baton Rouge, LA

174.4

165.0

163.0

159.4

166.2

4.3%

Beaumont-Port Arthur, TX

123

127.4

132.4

129.1

127.0

-1.6%

Binghamton, NY

111.2

113.7

115.7

110.3

102.8

-6.8%

Birmingham-Hoover, AL

161.3

153.9

146.1

130.4

135.1

3.6%

Bismarck, ND

152.9

155.2

156.6

153.3

157.9

3.0%

Bloomington-Normal, IL

154

159.8

152.8

153.8

151.9

-1.2%

Boise City-Nampa, ID

206

188.7

153.8

157.1

135.3

-13.9%

Boston-Cambridge-Quincy, MA-NH**

395.6

361.1

332.6

290.7

321.8

10.7%

Boulder, CO

376.2

359.6

345.5

328.4

335.8

2.3%

Bridgeport-Stamford-Norwalk, CT

486.6

437.9

379.2

340.9

348.1

2.1%

Buffalo-Niagara Falls, NY

104

105.4

113.6

99.2

106.6

7.5%

Cape Coral-Fort Myers, FL

252.1

152.6

87.6

87.3

86.4

-1.0%

Cedar Rapids, IA

136.2

136.5

139.7

127.3

136.1

6.9%

Champaign-Urbana, IL

144.1

141.9

140.6

141.6

127.0

-10.3%

Charleston-North Charleston, SC

215.4

206.2

192.7

188.2

194.6

3.4%

Charleston, WV

122.5

126.9

126.8

119.2

116.5

-2.3%

Charlotte-Gastonia-Concord, NC-SC

204.3

197.8

189.1

171.5

171.4

-0.1%

Chattanooga, TN-GA

130.9

129.1

122.6

117.9

112.9

-4.2%

Chicago-Naperville-Joliet, IL

276.6

245.6

199.2

185.6

176.4

-5.0%

Cincinnati-Middletown, OH-KY-IN

140.8

131.8

125.8

106.5

121.9

14.5%

Cleveland-Elyria-Mentor, OH

130

108.5

106.8

69.2

106.4

53.8%

Colordo Springs, CO

217.5

205.5

189.8

180.0

184.8

2.7%

Columbia, MO

147.1

146.3

146.7

152.6

139.5

-8.6%

Columbia, SC

146.6

145.0

139.2

134.3

136.6

1.7%

Columbus, OH

147.4

139.3

134.9

118.3

125.8

6.3%

Corpus Christi, TX

136.5

139.1

134.3

126.3

129.5

2.5%

Cumberland, MD-WV

109.4

99.5

118.3

114.9

98.3

-14.4%

Dallas-Fort Worth-Arlington, TX

150.9

145.8

140.5

141.1

141.9

0.6%

Davenport-Moline-Rock Island, IA-IL

108.7

94.2

110.3

100.3

102.5

2.2%

Dayton, OH

115.6

107.0

104.1

79.7

97.9

22.8%

Decatur, IL

83.1

87.4

86.7

77.1

73.3

-4.9%

Deltona-Daytona Beach-Ormond Beach, FL

192.3

164.1

124.6

128.7

115.8

-10.0%

Denver-Aurora, CO

245.4

219.3

219.9

192.9

224.8

16.5%

Des Moines, IA

149.2

153.2

149.3

137.3

131.0

-4.6%

Dover, DE

207.5

206.2

197.1

201.0

190.0

-5.5%

Durham, NC

178.4

180.6

176.9

171.5

171.5

0.0%

Elmira, NY

81.6

87.7

87.3

77.1

90.8

17.8%

El Paso, TX

131.9

137.5

132.6

132.8

128.6

-3.2%

Erie, PA

98.1

99.5

97.9

85.9

95.7

11.4%

Eugene-Springfield, OR

239.6

224.7

203.7

210.8

194.8

-7.6%

Fargo, ND-MN

140.9

139.1

140.2

134.1

140.7

4.9%

Farmington, NM

191.1

190.6

187.5

191.2

190.9

-0.2%

Florence, SC

124.2

117.3

114.5

98.5

98.5

0.0%

Ft. Wayne, IN

97.1

92.6

94.0

80.6

93.2

15.6%

Gainesville, FL

211.1

188.6

167.6

160.3

154.7

-3.5%

Gary-Hammond, IN

134.2

127.7

119.2

92.0

108.8

18.3%

Glens Falls, NY

167.6

161.1

153.5

156.6

138.6

-11.5%

Grand Rapids, MI

129.4

100.9

87.4

72.0

90.7

26.0%

Green Bay, WI

150.7

146.2

136.2

138.4

131.6

-4.9%

Greensboro-High Point, NC

152

145.3

132.8

129.7

121.4

-6.4%

Greenville, SC

153.6

155.7

141.4

142.0

140.6

-1.0%

Gulfport-Biloxi, MS

154.5

140.2

133.9

132.8

128.8

-3.0%

Hagerstown-Martinsburg, MD-WV

208.5

185.8

157.1

167.1

145.4

-13.0%

Hartford-West Hartford-East Hartford, CT

263.2

246.2

232.0

222.3

225.9

1.6%

Honolulu, HI

643.5

624.0

596.2

598.3

621.2

3.8%

Houston-Baytown-Sugar Land, TX

152.5

151.6

153.1

138.5

150.1

8.4%

Indianapolis, IN

120.5

111.2

114.2

95.3

108.5

13.9%

Jackson, MS

139

128.7

134.9

122.6

121.8

-0.7%

Jacksonville, FL

189.2

174.6

145.9

154.1

144.9

-6.0%

Kankakee-Bradley, IL

134.5

130.8

129.2

116.6

118.2

1.4%

Kansas City, MO-KS

153.3

144.3

140.7

126.6

130.7

3.2%

Kennewick-Richland-Pasco, WA

169.2

166.1

167.1

159.3

176.5

10.8%

Kingston, NY

258.4

242.1

208.4

194.3

217.1

11.7%

Knoxville, TN

156.4

149.1

141.4

138.6

135.1

-2.5%

Lansing-E.Lansing, MI

126.8

97.7

80.7

65.6

77.1

17.5%

Las Vegas-Paradise, NV

297.7

220.5

142.9

155.3

137.0

-11.8%

Lexington-Fayette,KY

147.5

144.3

141.4

133.8

135.4

1.2%

Lincoln, NE

137.5

135.2

133.3

132.4

132.8

0.3%

Little Rock-N. Little Rock, AR

129.1

129.8

131.8

125.4

129.6

3.3%

Los Angeles-Long Beach-Santa Ana, CA

593.6

402.1

333.9

303.5

331.4

9.2%

Louisville, KY-IN

137.4

132.2

131.1

121.1

127.7

5.5%

Madison, WI

226.5

226.6

212.3

208.5

212.7

2.0%

Manchester-Nashua, NH

N/A

242.8

227.1

211.3

219.3

3.8%

Memphis, TN-MS-AR

137.2

119.3

119.2

96.1

113.9

18.5%

Miami-Fort Lauderdale-Miami Beach, FL

365.5

285.1

211.2

206.0

193.6

-6.0%

Milwaukee-Waukesha-West Allis, WI

223.4

212.3

193.4

190.8

203.8

6.8%

Minneapolis-St. Paul-Bloomington, MN-WI

225.2

202.0

177.7

174.1

162.0

-7.0%

Mobile, AL

136.4

134.2

127.6

127.9

116.4

-9.0%

Montgomery, AL

143.8

135.2

130.2

122.5

124.2

1.4%

New Haven-Milford, CT

286.5

263.8

235.7

216.5

227.9

5.3%

New Orleans-Metairie-Kenner, LA

160.3

160.5

160.1

150.8

154.6

2.5%

New York-Northern New Jersey-Long Island, NY-NJ-PA

469.7

437.9

381.4

373.5

380.4

1.8%

New York-Wayne-White Plains, NY-NJ

540.3

494.3

437.2

428.1

436.9

2.1%

NY: Edison, NJ

380.3

365.2

331.9

320.9

325.8

1.5%

NY: Nassau-Suffolk, NY

477.2

435.8

383.3

376.7

376.9

0.1%

NY: Newark-Union, NJ-PA

443.7

417.2

366.6

350.4

356.5

1.7%

Norwich-New London, CT

267.7

236.6

211.8

199.6

205.2

2.8%

Ocala, FL

164.6

137.5

107.4

108.6

92.9

-14.5%

Oklahoma City, OK

134.9

128.1

140.5

140.4

140.7

0.2%

Omaha, NE-IA

138

135.2

133.7

129.0

132.9

3.0%

Orlando, FL

261.3

208.9

147.4

154.8

131.6

-15.0%

Palm Bay-Melbourne-Titusville, FL

183.6

144.7

107.0

114.3

101.7

-11.0%

Pensacola-Ferry Pass-Brent, FL

165.6

155.7

145.7

137.2

140.7

2.6%

Peoria, IL

118.6

122.1

119.4

109.8

105.5

-3.9%

Philadelphia-Camden-Wilmington, PA-NJ-DE-MD

234.9

231.4

215.9

206.0

209.8

1.8%

Phoenix-Mesa-Scottsdale, AZ

257.4

191.3

137.0

129.2

140.9

9.1%

Pittsburgh, PA

120.7

118.4

118.9

103.4

116.0

12.2%

Pittsfield, MA

217.4

212.6

186.4

180.0

188.5

4.7%

Portland-South Portland-Biddeford, ME

242.7

229.3

203.5

192.1

200.0

4.1%

Portland-Vancouver-Beaverton, OR-WA

295.2

280.1

244.1

248.6

237.4

-4.5%

Providence-New Bedford-Fall River, RI-MA

286.5

250.6

218.5

202.4

211.9

4.7%

Raleigh-Cary, NC

224.2

223.4

215.4

223.0

222.9

0.0%

Reading, PA

154.7

155.7

152.8

145.2

147.6

1.7%

Reno-Sparks, NV

321.4

259.1

193.8

209.8

181.4

-13.5%

Riverside-San Bernardino-Ontario, CA

379.5

234.2

169.7

172.5

180.5

4.6%

Rochester, NY

117.9

117.0

116.4

105.6

112.2

6.3%

Rockford, IL

119.3

117.0

108.2

100.0

100.1

0.1%

Sacramento–Arden-Arcade–Roseville, CA

342.8

216.7

180.5

169.3

179.4

6.0%

Saginaw-Saginaw Township North, MI

82.1

62.2

56.9

30.3

60.8

100.7%

Saint Louis, MO-IL

145.4

133.2

127.1

100.9

116.1

15.1%

Salem, OR

228.3

208.8

183.7

200.0

193.3

-3.4%

Salt Lake City, UT

232

229.6

217.0

230.1

203.8

-11.4%

San Antonio, TX

153.2

152.8

149.3

145.2

142.2

-2.1%

San Diego-Carlsbad-San Marcos, CA

588.7

385.6

359.5

330.5

379.0

14.7%

San Francisco-Oakland-Fremont, CA

804.8

622.0

493.3

402.0

518.2

28.9%

San Jose-Sunnyvale-Santa Clara, CA

836.8

668.0

530.0

450.0

560.0

24.4%

Sarasota-Bradenton-Venice, FL

310.9

240.6

170.5

155.2

167.6

8.0%

Seattle-Tacoma-Bellevue, WA

386.9

357.2

306.2

315.2

302.6

-4.0%

Shreveport-Bossier City, LA

135.6

138.5

147.0

136.0

146.4

7.6%

Sioux Falls, SD

144.5

142.3

139.2

136.6

144.4

5.7%

South Bend-Mishawaka, IN

90.7

86.0

85.2

61.8

69.5

12.5%

Spartanburg, SC

128.6

127.3

120.7

109.1

117.1

7.3%

Spokane, WA

193.8

191.2

175.2

180.0

170.1

-5.5%

Springfield, IL

109

108.0

113.9

111.4

115.5

3.7%

Springfield, MA

211.9

200.6

186.4

170.1

182.3

7.2%

Springfield, MO

122.6

121.1

114.6

116.3

115.2

-0.9%

Syracuse, NY

121.8

120.2

121.0

113.7

116.6

2.6%

Tallahassee, FL

179.5

179.9

150.9

156.0

154.4

-1.0%

Tampa-St.Petersburg-Clearwater, FL

214.9

173.0

140.7

135.3

133.9

-1.0%

Toledo, OH

106.6

91.2

83.4

65.5

74.2

13.3%

Topeka, KS

111.9

108.0

108.4

106.5

98.5

-7.5%

Trenton-Ewing, NJ

307.1

303.2

263.7

252.5

230.1

-8.9%

Tucson, AZ

244.8

204.3

172.5

176.4

166.8

-5.4%

Tulsa, OK

N/A

136.9

130.1

127.0

124.8

-1.7%

Virginia Beach-Norfolk-Newport News, VA-NC

226.8

220.0

210.0

201.0

195.0

-3.0%

Washington-Arlington-Alexandria, DC-VA-MD-WV

430.8

343.4

308.6

279.4

292.6

4.7%

Waterloo/Cedar Falls, IA

112.8

111.5

110.6

97.3

109.5

12.5%

Wichita, KS

115.6

121.8

118.7

108.1

114.9

6.3%

Worcester, MA

274.6

237.1

217.7

189.6

209.8

10.7%

Yakima, WA

156.5

153.3

155.2

143.5

154.6

7.7%


Source: Realtor.org

Copyright 2010 The Associated Press. All rights reserved.

Vander Zalm takes advantage of Campbell’s terrible ratings

Tuesday, May 11th, 2010

Vaughn Palmer
Sun

One year after Premier Gordon Campbell won a third term by promising to make the economy the No. 1 priority, he can point to some encouraging news on that front.

“B. C. and Ontario will lead all other provinces in economic growth this year,” the Conference Board of Canada reported Monday.

“The economic impact of the Olympics will add roughly 0.7 percentage points to the province’s bottom-line growth this year. But it is the vast improvement in the forestry, manufacturing and construction sectors that will solidify the economic recovery.”

Almost simultaneously comes news that for the first time in four years, U.S. lumber prices have recovered sufficiently to eliminate the export tax penalty on shipments from Canada.

The recovery in forestry, like other sectors, is expected to vary widely across the province, nor is it sure to last. Sporadic and iffy would be more like it. Still, the evidence to date supports the narrative that Campbell offered to voters a year ago.

“The most important election in a generation,” he called it. “On May 12 you will choose whether to build confidence in B.C. that will provide more opportunities for our citizens, or whether to choose an Opposition that will destabilize our economy and cost jobs in every region of the province.”

Campbell thus seized on the one issue that the opinion polls had consistently identified as his strongest suit in running against the New Democratic Party. Moreover, by the end of a losing campaign, NDP leader Carole James came to agree with the B.C. Liberal leader about the deciding factor.

“I think it’s clear the economy was an issue,” she told reporters as the votes were still being counted on election night. “People felt they wanted someone with experience who had been in the premier’s chair already. I think that’s very clear.”

So Campbell won an election on the question of who could best preside over the economy. A year later, B.C. is poised to lead the country in economic growth. And if that were all that counted in the intervening 12 months, the premier ought to be on top of the world, never mind the opinion polls.

Except, of course, it hasn’t worked out that way.

One year after the election, the B.C. Liberals are racking up their worst polling numbers in years, the New Democrats their best.

Most astonishing of all, the 2010 Winter Olympics, far from generating the anticipated multibillion-dollars‘ worth of good news for the premier, appears to have had zero impact on his political fortunes.

Campbell waved the flag at every opportunity, wore his mittens everywhere, shouted himself hoarse, and nevertheless emerged from the Games spotlight with some of the most wretched leadership ratings in a generation.

In the most recent Angus Reid survey, respondents branded him as arrogant (72 per cent), secretive (56 per cent), dishonest (55 per cent), and uncaring (51 per cent). ( “But other than that, how did you like the premier?” one wanted to ask the panel as a followup).

Not much doubt about what placed him on this apparent road to ruin. Scandals, program cuts, an electorate grown weary of an overbearing leadership style are among the signposts. But the turning point was the decision, announced just weeks after the election, to reverse B.C.’s long-standing opposition to harmonizing the provincial sales tax with its federal counterpart.

The surprise change of direction — a sneak attack on the electorate, no less — set in motion a taxpayer revolt that is still growing in strength.

Witness the announcement Monday from organizers of the anti-HST petition drive. After just five weeks, they are already claiming to have gathered the signatures of some 400,000 British Columbians. If all those names check out, it would be half as many people as voted Liberal in the last election.

Increasingly, the petition drive has been personalized into an attack on Campbell’s continued leadership of the province. The leader of the anti-HST campaign, Bill Vander Zalm, made that explicit when asked what would be the next step if the government doesn’t back off the HST.

Recall, he replied, but recall aimed at vacating the seat of a single member of the legislature. “The member for Vancouver-Point Grey,” meaning Campbell himself.

Intriguing. The New Democrats have talked about recalling enough Liberals to strip the governing party of its legislative majority and forcing an election that would bring the NDP to power.

Vander Zalm suggests more of a targeted approach. No need to risk opening the door to an NDP administration at this point. Rather, recall Campbell, then see if the other Liberals, once freed of the heavy hand of his leadership, would execute a change of direction on their own.

Pure mischief on the part of the former premier, to be sure.

But given the growing mood of discontent over Campbell in the governing party, I expect some Liberals might support the idea of recall, providing it were confined to a surgical strike on the premier and party leader.

© Copyright (c) The Vancouver Sun

Criminals find a gold mine in stolen debit card numbers

Tuesday, May 11th, 2010

Unlike other gangs, the thieves who want to rip off your debit card information prefer to keep a low profile.

Matthew Claxton, Langley Advance
Sun

Fighting gangs: The Langley Advance continues its look at gangs and the effect they have on the community. Photograph by: file, Langley Advance

They’re organized criminals, but they don’t tattoo gang names on their bodies, they don’t wear colours, and they don’t come up with snappy names.

Cst. Steven Kuan of the economic crime section of Langley’s RCMP spends his time tracking the gangs who want to steal the data from your debit card and empty your bank account.

“We’re finding very organized crime groups behind it,” Kuan said.

Langley officers recently arrested a man from Montreal who had withdrawn money at four local banks. He was carrying numerous blank cards, each one labelled with a PIN number and a serial number.

The man was on his cellphone when police caught up with him.

Within hours, all the fake debit cards had been duplicated and were being used to withdraw money from other cash machines across the country, Kuan said.

Kuan said criminals have spent the past several years improving their techniques for ripping off Interac and similar card systems.

The scam begins with a stolen or purchased PIN pad, the sort used in countless businesses. The crooks will take them apart and add their own components.

The device still works, but it also records the magnetic strips of your card, along with your personal identification number.

A member of the organization will enter a restaurant or store, usually close to closing time, and while the clerk isn’t looking, they will swap out the store’s PIN pad for their own modified version.

“Now it’s a full-fledged skimming operation,” Kuan said. If the store’s employees don’t notice the swap, they’ll continue to swipe every card through the machine.

In the past, the criminals would leave their machine in place for about a month, then steal it back to get at the PIN data.

Now, they don’t ever have to touch it again.

“They now have wireless chips installed,” Kuan said.

A crook will approach with a Bluetooth-equipped PDA or computer and simply download all the stolen numbers.

Next, the organizers of the gangs will make up new cards with the same information, and send out their low-level runners to extract cash from ATMs.

“These guys are just recruited on the street,” said Kuan.

The organizers use some unusual methods to control their runners. In some cases, the organizers co-ordinate a spree of debit fraud by giving the runners small safes packed with debit cards. At the appointed hour, the runners are sent a text message with the safe’s combination. They open it and set off to get as much cash as possible, moving from bank machine to bank machine.

The runners must keep the cash and receipts from the ATMs they hit, Kuan said.

While police haven’t had any reports of violence in these groups, it’s possible that violence is used to keep the runners from ripping off the organizers, Kuan said. A runner beaten for skimming money wouldn’t come forward to police.

Some of those arrested have police records for violence, although not linked to the skimming operations.

At least three separate groups are operating right now in Canada, with between three and 30 people involved at any one time. Many seem to be based out of Montreal, but the criminals will fly their whole gangs around the country, ripping off small towns and big cities alike.

Unlike a drug-running gang member, most of the debit scammers have a fairly high level of education and are skilled with computers and electronics.

While they could get legitimate jobs, they find crime more lucrative.

The best way to protect yourself against the PIN-thieving gangs is to change your PIN on a regular basis, Kuan noted.

For businesses, the RCMP is running programs such as Project Protect, which involves training employees to check the serial number on their PIN pads after stores close.

© Copyright (c) Lower Mainland Publishing

Housing market forges ahead amid mortgage concerns

Tuesday, May 11th, 2010

Garry Marr
Province

A new report from the country’s mortgage brokers suggests up to 375,000 Canadians with home loans are “challenged” by current rates and that figure would more than double if interest rates climb to 5.25 per cent.

The report comes on the same day Canada Mortgage and Housing Corp. said builders continue with new home construction surpassing the 200,000 level in April on an seasonally adjusted annualized basis — levels not seen since 2008.

“I think overall the message is that we are being prudent and doing well. There are a lot of stats to support that,” said Jim Murphy, chief executive of the Canadian Association of Accredited Mortgage Professionals, whose study done in April found a further 475,000 mortgage holders would have trouble making payments if rates rose to 5.25 per cent.

According to the group, there are 9.3 million homeowners in Canada and about 5.55 million have mortgages. Of concern is the number of consumers with variable rate mortgages, now as low as 1.75 per cent, who could be affected if rates rise.

Last month, the government moved to push people into fixed-rate mortgages by requiring anybody borrowing for a term of fewer than five years to qualify based on the posted rate — now 6.1 per cent. Consumers who lock in for a term five years or longer can qualify based on the rate on their actual contract.

The CAAMP survey found that while 65 per cent of those borrowing have gone to a fixed rate, 29 per cent still remain variable with the rest having a mixed mortgage. Of the 475,000 who could be vulnerable if rates rise, 275,000 are in variable rates.

The housing market also continues to get a boost from consumers hurrying to buy homes in Ontario and B.C. before new taxes kick in.

© Copyright (c) The Province

Computing in the clouds

Monday, May 10th, 2010

Eric Taub
Other

Eagles go out on a high

Monday, May 10th, 2010

After nearly 40 years, the iconic band still gets a rush from fans’ energy, Don Henley says

Graeme McRanor
Sun

EAGLES

Timothy B. Schmit, Glenn Frey, Don Henley and Joe Walsh will play plenty of songs from the Eagles’ back catalogue at their Vancouver shows.

Where: GM Place/Pacific ColiseumWhen: Sunday, Monday at GM Place/ Friday at Pacific Coliseum

Few working bands can conjure up time and place quite like the Eagles. And with a back catalogue that includes hits Life in the Fast Lane, Hotel California, Witchy Women, Take It Easy, Desperado and One of These Nights, there’s little doubt that the band’s best work is behind them.

“I had hoped that we could go for two more years and reach the 40-year milestone,” singer-songwriter Don Henley told The Vancouver Sun in an exclusive interview. “But it’s looking more and more like the end of the trail is imminent.”

Henley has eaten his words in the past. He once famously quipped post-breakup in 1980 that the Eagles would reunite “when hell freezes over.” Fans will remember the band’s 1994 reunion tour and live album, fittingly called Hell Freezes Over. Still, with the key members of the group now in their early 60s (the band is collectively 247 years old), this tour will surely be the Eagles’ final flight.

It’s a ride that, starting in the early 1970s when the Eagles first became birds of a feather as a band, hasn’t always been smooth. Like Life in the Fast Lane, there was turbulence along the way, not much noticed by an increasingly hooked fan base.

“We weren’t the Stones, but we weren’t the Osmonds either,” founding member Glenn Frey told 60 Minutes in November 2007 after the release of Long Road Out of Eden, the band’s first all-original studio album since 1979. “Closer to the Stones than the Osmonds.”

Yet, save for the band’s breakup, that self-described “14-year vacation” from 1980 to 1994, internal power struggles and some well-publicized controversy with former member Don Felder — he was fired, subsequently sued Henley and Frey, they countersued, then Felder wrote a tell-all book called Heaven and Hell: My Life in the Eagles — the band has endured.

So, too, has the music. “Every time we play a concert, we are reminded of how much these songs mean to people,” says Henley. “Some of this material has held up for almost 40 years, and obviously we feel good about that and we’re grateful.

“It’s very satisfying, I think, for any artist who has created a body of work to see that work become a part of the culture. For us, the songs have always been first and foremost; the rest of the backwash from success is a side-effect that we don’t much care for.

“We don’t actively seek publicity, and basically live quiet, low-profile lives. We’re not in the tabloids and rarely in the music magazines. It’s always been primarily about the songs — the writing, recording and performing — and our fans know that we make an effort.”

So kudos to the boys — the current lineup is Frey, Henley, Joe Walsh and Timothy B. Schmit -for touring on a new album. With its legendary status, the band could easily have coasted into the sunset playing best-of concerts for the sentimental set.

Fair to say, though, that this tour, which officially kicked off in 2008, still leans heavily on the hits. The lengthy, two-act set list (three hours, according to Henley) also includes Henley’s seminal solo hits Dirty Laundry, Boys of Summer and All She Wants to Do Is Dance. (Though cheesy soundtrack aficionados will be left with hanging heads, as Glenn Frey’s ’80s solo hit, The Heat Is On, from the film Beverly Hills Cop, is mercifully not on the to-do list).

“It remains important to all of us to include several of the tracks from the Long Road Out of Eden album in the show, plus a couple of other songs that we don’t normally do,” said Henley. “We put some thought into the set list and came up with what we think is a good balance of old and new stuff.”

All of which will be played with vigour by a band that Henley says is much better today than the original version. Though one thing hasn’t changed: the pleasure the group gets from playing for an audience.

“The songs move the fans, the fans give us their energy, and we give it back to them,” he said. “It’s a beautiful, symbiotic relationship.”

© Copyright (c) The Vancouver Sun