The Canadian Real Estate Market by location
Penelope Graham
other
From a big picture perspective, it would seem the Canadian real estate market is poised for optimism; the latest crop of July data from the national real estate association points to strengthening sales activity and price growth, as buyers recuperate from the impact of stricter mortgage rules and affordability-slashing policy changes.
After a tepid start to the year, national home sales improved for the third month in a row, reports the Canadian Real Estate Association, edging up 1.9 per cent from June, with prices increasing by 1 per cent to an average of $481,500.
For individual buyers and sellers, however, national data doesn’t necessarily reflect market conditions in their own regions. In order to make a truly informed decision, it’s important to know what’s happening on a local level – something an aggregate snapshot can’t provide. For example, while CREA’s latest numbers hint at a recovery, much of that improvement is skewed by conditions in the Toronto and Greater Golden Horseshoe regions, in sharp contrast to slower activity in Vancouver and much of the Atlantic provinces.
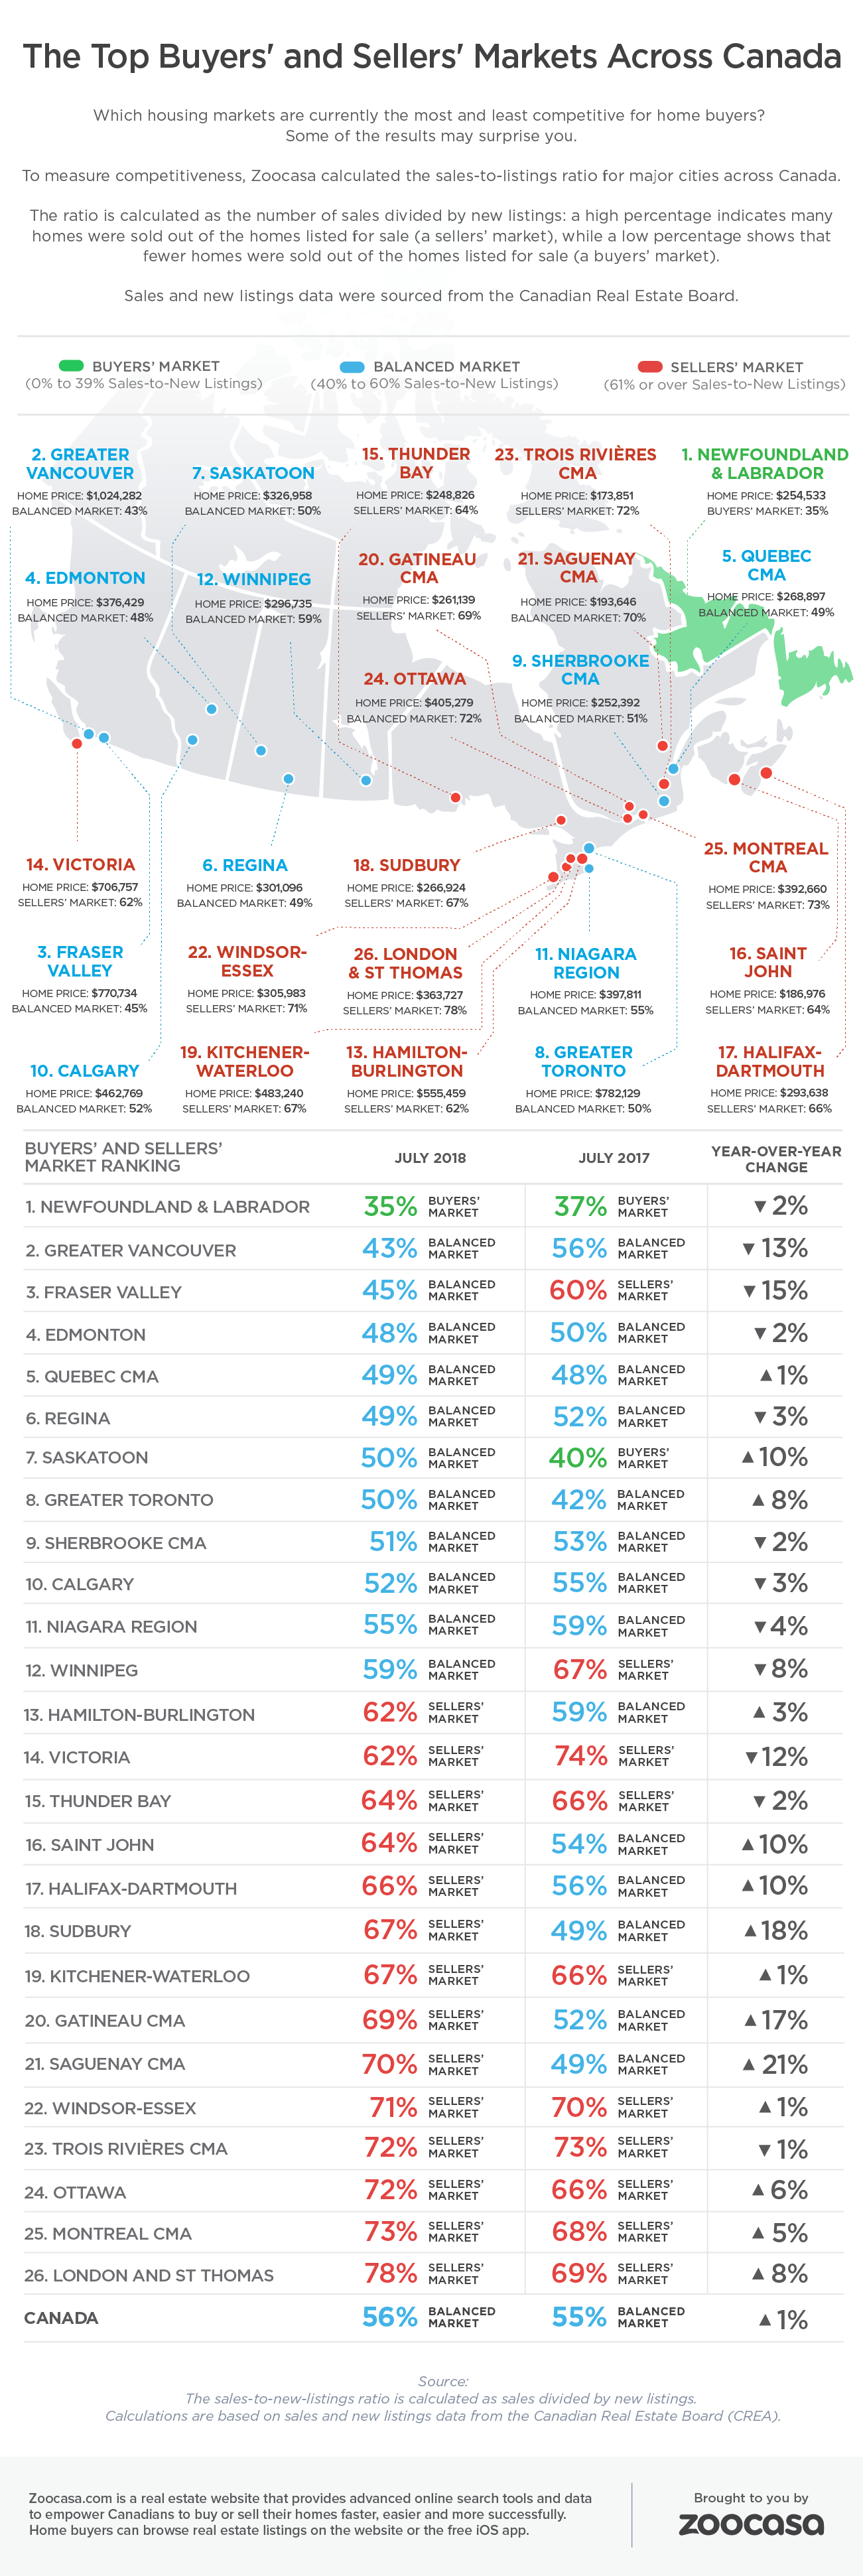
Instead, activity at a local level can be more effectively measured using the sales-to-new-listings ratio: calculated by dividing the number of sales by the number of new listings over a specific time frame, this metric reveals what percentage of newly-listed homes are being snapped up, or are languishing on the market. This helps provide buyers and sellers insight to the level of competition they’ll face when entering the market.
According to CREA, a ratio between 40 – 60 per cent indicates a balanced market, while above and below that threshold indicate sellers’ and buyers’ conditions, respectively.
Canada as a whole remains in balanced territory, with a ratio of 56 per cent. That’s skewed slightly more toward a sellers’ market than the 55 per cent recorded in July 2017.
However, this differs widely in the 26 main markets tracked by CREA, as factors such as incomes, housing supply, and local economies underpin demand for real estate; a seller in Newfoundland faces a very different reality than one in Victoria, for example. So, from sea to shining sea, which are the best markets in Canada to be a buyer or seller – and which have changed dramatically over the past year?
The Top 5 Markets for Buyers
While the following Census Market Areas may not be the most affordable in Canada, they do boast the lowest sales-to-new-listings ratios throughout the nation, indicating the lowest level of buyer competition. Those looking to ascend the property ladder in these cities will encounter fewer competitive hurdles such as bidding wars, as the number of sales are too few to outweigh new inventory. Sales activity ranges from roughly flat to steep declines, from the -0.8 per cent recorded in the Edmonton real estate market, to the -33.4-per-cent drop in BC’s Fraser Valley.
- Newfoundland and Labrador: 35%
- Greater Vancouver: 43%
- Fraser Valley: 45%
- Edmonton: 48%
- Quebec CMA: 49%
The Top 5 Markets for Sellers
Good news for those looking to list in these CMAs; in these strong sellers’ markets, your home likely won’t linger for long, and is more likely to draw in multiple offers, as strong buyer demand outstrips the number of homes available for sale. Some regions, such as the Ottawa real estate market, are becoming especially popular for their supply of affordable single-family homes, drawing a steady stream of buyers from more expensive neighbouring municipalities.
- London and St. Thomas: 78%
- Montreal: 73%
- Ottawa: 72% and Trois Rivieres: 72%
- Windsor-Essex: 71%
- Saguenay CMA: 70%
Markets with the Greatest Year-Over-Year Declines
The last couple of years have been tumultuous in real estate markets across Canada, as a new mortgage stress test has further crimped affordability for borrowers of new mortgages. British Columbia, in particular, has weathered considerable challenges, as tougher mortgage hurdles compound with foreign buyer and speculation taxes, making steep affordability even more acute, and dampening home buyer demand. The following markets have seen the greatest year-over-year declines in their sales-to-new-listings ratios, indicating faster rates of cooling competition.
- Fraser Valley: y-o-y change of -15%
- Greater Vancouver: y-o-y change of -13%
- Victoria: y-o-y change of -11%
- Winnipeg: y-o-y change of -8%
- Niagara Region: y-o-y change of -4%
Markets with the Greatest Year-Over-Year Increases
The ratios in these markets reflect heating conditions, with a healthy uptick in sales, well offsetting any new product placed on the market. These are housing markets to watch for, as positive underlying fundamentals support growing popularity. Comparative affordability appears to be a factor: each of the following markets boasts an average price hundreds of thousands of dollars below Toronto and Vancouver, Canada’s largest markets.
- Saguenay: y-o-y change of +21%
- Sudbury: y-o-y change of +18%
- Gatineau: y-o-y change of +17%
- Halifax-Dartmouth: y-o-y change of +11%
- Saskatoon: y-o-y change of +10% and Saint John: y-o-y change of +10%
© 2015-2017 Zoocasa Realty Inc.
