Archive for January, 2019

Vancouver home sales fall to lowest point since 2000

Monday, January 7th, 2019

Home sales in Metro Vancouver plummeted to their lowest level in nearly two decades

Canadian Real Estate Wealth

Home sales in Metro Vancouver plummeted to their lowest level in nearly two decades last year and the average home price moved lower in the once red-hot real estate market.

The total number of homes sold in Metro Vancouver last year fell to 24,619, marking the lowest total since 2000, according to data from the Real Estate Board of Greater Vancouver. That’s down 31.6% from nearly 36,000 in 2017 and 25% below the region’s 10-year average.

The composite benchmark price for a home, which includes detached properties, townhomes, and condominiums, dropped 2.7% from December 2017 to finish the year at $1,032,400.

Detached homes led the fall as their benchmark price fell 7.8% from December 2017 to $1,479,000.

Townhome and condominium prices saw small gains over the year. The benchmark price of a townhouse rose 1.3% year-over-year to $809,700, while the benchmark price of a condominium advanced 0.6% to $664,100.

“As the total supply of homes for sale began to accumulate in the spring, we began to see downward pressure on prices across all home types throughout the latter half of the year,” said REBGV president Phil Moore.

Condo prices were down 0.6% from November 2018, while townhome prices fell 1.1% month-over-month.

Moore called 2018 “a transition period” for the region’s housing market, which moved away from sellers’ market conditions.

“High home prices, rising interest rates and new mortgage requirements and taxes all contributed to the market conditions we saw in 2018,” he said.

The board’s data came right after BC Assessment, an independent, provincial Crown corporation whose estimates are used to determine property taxes, released data showing a drop of up to 15% on the estimated values of some detached homes in urban areas of Greater Vancouver as of July 1, 2018.

The median single-family residential property value in Vancouver, Burnaby, and North Vancouver fell 4%, according to BC Assessment. In the district of West Vancouver the drop was 12%, while on the University Endowment Lands it was 11%.

As the real estate market softens in some areas, Greater Vancouver is now seeing signs of moderation, BC Assessment said in a statement.

Other areas, though, still experienced gains. The median single-family residential property value in Port Moody, Port Coquitlam, Squamish rose between 4 and 6%.

Residential strata units, like condominiums, rose between 0 and 25% in urban areas of Greater Vancouver, according to the data. 

The Canadian Press

Copyright © 2019 Key Media Pty Ltd

Toronto posts 16% decline in sales for 2018

Monday, January 7th, 2019

Toronto Real Estate Board says that over the year new listings were down

Steve Randall
REP

Realtors in the Greater Toronto Area reported a total of 77,426 home sales through the MLS in 2018, down 16.1% from 2017.

Toronto Real Estate Board says that over the year new listings were down 12.7% to 155,843; while the average selling price across all property types slipped 4.3% year-over-year to $787,300.

Condos fared better with a 7.8% gain in average selling price compared to 2017 and this meant the City of Toronto and its surrounding areas posted a higher average selling price overall due to the large share of condo sales in these markets.

“Higher borrowing costs coupled with the new mortgage stress test certainly prompted some households to temporarily move to the sidelines to reassess their housing options.  With this said, it is important to note that market conditions were improved in the second half of the year, both from a sales and pricing standpoint,” said Garry Bhaura, TREB President.

Jason Mercer, TREB’s Director of Market Analysis and Service Channels, added that there was a clear decline in new listings in 2018 compared to the previous year.

“In many neighbourhoods, despite fewer sales from a historic perspective, some buyers still struggled to find a home meeting their needs. The result was a resumption of a moderate year-over-year pace of home price growth in the second half of the year. Price growth was strongest for less-expensive home types, as many home buyers sought more affordable home ownership options,” he said.

Copyright © 2019 Key Media Pty Ltd

I’m grateful for these 5 things in the real estate industry

Monday, January 7th, 2019

Five things I am especially grateful for

Mark Weisleder
REM

As we enter the new year, it is always a good idea to reflect on the past year and recognize all that is good in our industry. Here are five things I am especially grateful for.

1. The careful real estate agent:

Three times last year I was asked to represent buyers or sellers who had made their own private deal. When I looked at the paperwork, it did not take long to realize that the agreement was not valid or enforceable, because it was not accepted in a timely manner and/or conditions were not waived in time. It made me appreciate even more the detail that real estate agents take on every deal, to make sure everything is done in a timely manner. It is easy to take this for granted. Thank you to every careful agent out there who has entrusted their clients to our firm.

2. The real estate lawyer community:

There really is no such thing as a “simple” real estate deal and I always laugh to myself when a potential client describes their transaction that way. No one can appreciate the stress involved in making sure an agreement closes on time and with no issues than the real estate lawyer community. I am grateful for being able to work with other lawyers to make sure that especially when there are issues, we work together, for the benefit of our respective clients, to make sure that everything gets resolved in an amicable manner. No one wins when people go to court. Thank you to every lawyer I have had the pleasure of dealing with from opposite sides this past year.

3. Mortgage brokers and lenders:

Whether acting for private lenders or borrowers, it is easy to overlook the level of detail that goes on behind the scenes, to make sure not only that a borrower gets approved for a loan, but that all lender conditions are approved prior to the closing date, whether it is a purchase or a refinancing. It also means being available to assist in resolving issues, right up to the minute of closing. Thank you to every mortgage broker or lender who has assisted in making deals go as smoothly as possible.

4. My partners and staff:

Real estate transactions cannot be processed by one person. It takes a dedicated team of lawyers, law clerks, accounting and administrative staff to permit us to deliver on our promise of a stress-free closing of every real estate transaction. I am very grateful to my partners, law clerks and staff for all they do to permit me to do my own job of servicing clients that much easier.

5. Our clients:

There is no greater satisfaction than assisting a young family to realize their dream of home ownership. I appreciate the trust that clients give to me and my firm to assist and protect them in what is usually the largest transaction of their lives. We look forward to working this year with the rest of the real estate community of agents, lawyers, mortgage brokers and lenders to make sure that we always seek to improve the client experience in any way that we can.

© 2017 REM Real Estate Magazine

FINTRAC Publishes its First Assessment on Terrorist Activity Financing

Friday, January 4th, 2019

FINTRAC today published its Terrorist Financing Assessment: 2018

other

The assessment is the first of its kind in Canada and part of FINTRAC’s broader commitment to helping businesses comply with their obligations under the Proceeds of Crime (Money Laundering) and Terrorist Financing Act. The assessment’s financial and geographic indicators, in particular, will assist businesses in better identifying and reporting suspected terrorist activity financing. With enhanced suspicious transaction reporting from businesses, FINTRAC will be even better able to provide actionable financial intelligence to Canada’s police and national security agencies and financial intelligence units around the world.

The report does not evaluate the presence or effectiveness of the tools or measures the countries may have in place to counter the financing of terrorism.

The Terrorist Financing Assessment: 2018 was developed in close collaboration with FINTRAC’s national security partners as a part of the Government of Canada’s efforts to combat violent extremism and terrorism.

Quote

“As events of the past several years have shown, individual terrorists and terrorist groups pose a risk to countries around the world, including Canada. Our Terrorist Financing Assessment: 2018 will help businesses improve the quality of their reporting of suspected terrorist activity financing so that FINTRAC can provide actionable financial intelligence to Canada’s police and national security agencies and financial intelligence units around the world. Together, we all have a critical role to play in protecting Canadians and Canada’s financial system.”

Nada Semaan, Director and Chief Executive Officer, Financial Transactions and Reports Analysis Centre of Canada

Quick Facts

  • Countries determined to be at a higher risk of terrorist financing were selected based on their exposure to terrorists and/or terrorist activities, their role in the global financial system, and their counter-terrorist financing regulatory and enforcement regime, as well as Canada’s financial exposure to them, as determined by FINTRAC reporting; remittance flows, as reported by the World Bank; and data on trade volumes, as reported by Statistics Canada.
  • The Middle East, centred on Syria and Iraq, presents the greatest terrorist activity financing risk to Canada.
  • The South Asia region, centred on Afghanistan and Pakistan, is of high importance in the risk of terrorist activity financing to Canada.
  • The assessment includes Indicators of Financial Activities of Extremist Travellers given the risk to Canada posed by the extremist traveller phenomenon over the past several years.
  • Prepaid cards, mobile payments and other alternative payment methods are an emerging area of terrorist activity financing risk.
  • FINTRAC provided 645 disclosures of actionable financial intelligence in 2017–18 relevant to terrorism financing and threats to the security of Canada.

Related Products

Vancouver home sales fall to lowest yearly total in 18 years, detached home prices drop

Friday, January 4th, 2019

Vancouver home sales fall to lowest in 18 years

Tiffany Crawford
The Province

In 2018, Metro Vancouver home sales were the lowest in 18 years, according to the Real Estate Board of Greater Vancouver.

The board’s report, released Thursday, says there were 24,619 sales of detached, attached and apartment properties on the Multiple Listing Service, a 31.6 per cent decrease from the 35,993 sales in 2017.

Last year’s sales were the lowest since 2000, and were 25 per cent below the region’s 10-year sales average, according to the report.

Board president Phil Moore called 2018 a transition period away from the sellers’ market of previous years.

Moore says high home prices, rising interest rates, new mortgage requirements and taxes all contributed to the market conditions.

Home listings in Metro hit 53,614 in 2018. That is a 1.9 per cent decrease from the 54,655 homes listed in 2017 and a 6.9 per cent decrease from the 57,596 homes listed in 2016.

“The supply of homes for sale will be an important indicator to follow in 2019. We’ve had record building activity in recent years and many projects will complete soon. This will provide additional housing options for homebuyers across the region,” Moore said in a statement Thursday.

The composite benchmark price for all residential homes in Metro was down 2.7 per cent to $1,032,400. The price of detached homes was down 7.8 per cent.

Condo prices went up slightly, by 0.6 per cent over the past 12 months, but have declined 6.4 per cent since June. Townhomes have increased 1.3 per cent since December 2017, but have decreased 5.3 per cent in the last six months.

December sales were down by nearly half compared with December 2017. The report says 1,072 homes sold last month, a 46.8 per cent decrease from the 2,016 sales in December 2017 and a 33.3 per cent decrease from November 2018, when 1,608 homes sold.

© 2019 Postmedia Network Inc.

Metro condo market at odds with gains in property assessment

Friday, January 4th, 2019

Cooling Metro Vancouver condo market at odds with gains in property assessment

Derrick Penner
The Province

Condominium owners in Metro Vancouver are opening up 2019 property-assessment notices showing increases in value from a year ago. But much has changed in property markets since B.C. Assessment set those values on July 1.

Across most of Metro Vancouver, condo prices are down 6.4 per cent since July to a benchmark prices $664,100, according to figures released Thursday by the Real Estate Board of Greater Vancouver. The benchmark is based on the average price, adjusted to reflect “typical” condos among those sold.

That is in contrast to B.C. Assessments’ July 1 appraisals that showed average increases from July 2018 of anywhere from six per cent in the city of Vancouver to as much as 23 per cent in Whistler, while assessments on less affordable detached homes were down four per cent in Vancouver and North Vancouver and as much as 12 per cent in West Vancouver.

“Since then, the numbers suggest a broader decline in the market,” said Bryan Yu, deputy chief economist with Central 1 Credit, with sales and prices for condos trending lower along with detached homes.

“This year, when (municipal property) taxes roll around, you’re going to see condo owners take a little more of a hit in terms of their taxes, relative to single-family,” Yu said.

Yu said sales figures show that the condo market became “red hot” in 2016 as detached-home prices soared out of the reach of many buyers, pushing them into the strata-property market. That trend lasted through 2017 and into 2018.

Now, factors such as higher mortgage interest rates and stiffer mortgage-qualification rules have reduced the spending power of buyers and cooled demand at all levels of the market, Yu said.

“In terms of the overall Lower Mainland, our view, at least for benchmark prices, is that they’re already down six per cent (for condominiums),” Yu said. “We see another up to four or five per cent more decline in the broader market (in 2019).”

The Real Estate Board of Greater Vancouver said on Thursday that 24,619 sales were recorded through MLS for all of 2018, a near 32 per cent decline from 2017. Within that, condo sales represented 12,771 transactions, a 30 per cent reduction.

And since July, in Metro Vancouver submarkets, benchmark condo prices have declined as much as 14 per cent in Squamish (now $455,900), 10.3 per cent in Port Moody (now $627,300), 6.3 per cent on Vancouver’s east side (now $538,000) and seven per cent on Vancouver’s west side (now $783,700), according to real-estate-board figures.

For the B.C. Assessment Authority’s assessors, such changing markets don’t create a big challenge, said regional assessor Tina Ireland, because their task is to provide a snapshot of property values on July 1.

“The reason why we do that is so the same market conditions apply to everyone’s assessment,” Ireland said, “to determine a property owners’ share of property taxes in their community.”

However, Ireland said it can be “a bit more of a challenge” explaining assessments to property owners who might be opening their assessment notices and saying “my property is no longer worth that.”

B.C. Assessment took about 1,000 calls from the public on Wednesday, the authority’s first business day since assessments were made public Dec. 31, which is a 60 per cent increase from 2017, Ireland said, but it is difficult to know how big a factor the declining market values is in those inquiries.

For those homeowners who have questions, Ireland suggested consulting the authority’s website for more information about their assessments. It also has tools to compare assessments.

If homeowners have more questions, Ireland said they can call B.C. Assessment for an explanation, and if they are still not satisfied, have the right to appeal their assessments. The deadline to file an appeal is Jan. 31.

© 2019 Postmedia Network Inc.

Home sales plummet in the Tri-Cities

Friday, January 4th, 2019

Sluggish transaction volumes putting downward pressure on real estate values, says REBGV president Phil Moore

Gary McKenna
other

The last time home-sale numbers in Metro Vancouver were this low, Destiny’s Child was topping the charts and Gladiator was still in theatres.

The Real Estate Board of Greater Vancouver (REBGV) said Thursday that transaction figures for the region have fallen to their lowest levels since 2000, dropping 31.6% below last year’s numbers, which was already 25% below the 10-year sales average.

In the Tri-Cities, the number of properties that changed hands in December fell 32.3% compared to the same month last year. Townhouses saw the sharpest drop, with sales activity falling 51.6%, while condo sales saw a drop of 38.9%. Detached home transactions fell 11.9%.

“This past year has been a transition period for the Metro Vancouver housing market away from the sellers’ market conditions we experienced in previous years,” said Phil Moore, presidents of the REBGV. “High home prices, rising interest rates and new mortgage requirements and taxes all contributed to the market conditions we saw in 2018.”


City

Detached Home

Townhouse

Condominium

Coquitlam

-13.6%

-25%

-36.6%

Port Coquitlam

-15%

-54.5%

-41.9%

Port Moody

20%

-81.3%

-46.2%

Sales activity fell in December compared to the same month in 2017 across all property types.

While sales have been sluggish, prices are starting to take a tumble.

In Coquitlam, the home price index shows a 6.5% drop in benchmark property values, while PoCo has fallen 7.7% and Port Moody has seen a 7.3% decrease.

The variations in prices depends on the property type.

In the last six months, detached homes have seen values fall 7.5% in Coquitlam, 8.1% in Port Coquitlam and 4.3% in Port Moody. Condominium values have also fallen during the same time period, with the benchmark value dropping 6% in Coquitlam, 7.8% in Port Coquitlam and 10.3% in Port Moody.

In the Lower Mainland, the average benchmark decrease for all property types was 6.3% since June.

“As the total supply of homes for sale began to accumulate in the spring, we began to see downward pressure on prices across all home types throughout the latter half of the year,” Moore said.

ACROSS METRO VANCOUVER

Across the region, REBGV said home sales totalled 1,072 in December, a 46.8% decrease from the 2,016 sales recorded during the same month in 2017 and 33.3% below November 2018.

The number of home listings has stayed relatively stable in 2018, falling 1.9% from the 54,655 listed in 2017 and 6.9% compared to the 57,596 in 2016.

“The supply of homes for sale will be an important indicator to follow in 2019,” Moore said. “We’ve had record building activity in recent years and many projects will complete soon. This will provide additional housing options for home buyers across the region.”

Glacier Community Media © Copyright ® 2019

Fraser Valley can expect “modest” tax assessment change

Thursday, January 3rd, 2019

The 2019 assessment notices from BC Assessment are based on July 2018 values

Steve Randall
Canadian Real Estate Wealth

The property assessments of more than 494,000 properties in the Fraser Valley are in the mail.

The 2019 assessment notices from BC Assessment are based on July 2018 values and for most they will have changed from the notices received a year ago.

“The majority of residential home owners within the Fraser Valley can expect a modest change compared to last year’s assessment,” says Fraser Valley Deputy Assessor Brian Smith. “As of July 1, we continued to see strong market activity in the strata residential market throughout the region, where as the single family residential market was relatively stable.”

Overall, the Fraser Valley’s total assessments increased from almost $489.8 billion in 2018 to more than $540.4 billion this year. A total of almost $10.7 billion of the region’s updated assessments is from new construction, subdivisions and rezoning of properties.

BC Assessment says that homeowners should check the notices and get in contact by the end of this month if they spot any errors.

“If a property owner is still concerned about their assessment after speaking to one of our appraisers, they may submit a Notice of Complaint (Appeal) by January 31st, for an independent review by a Property Assessment Review Panel,” adds Smith.

“It is important to understand that increases in property assessments do not automatically translate into a corresponding increase in property taxes,” explains Smith. “How your assessment changes relative to the average change in your community is what may affect your property taxes.”

Market trends for single family residential properties by geographic area:

Community

2018 Average

Assessed Value

as of July 1, 2017

2019 Average

Assessed Value

as of July 1, 2018

% Change

City of Surrey

$1,004,000

$1,042,000

+4%

City of White Rock

$1,340,000

$1,313,000

-2%

City of Richmond

$1,570,000

$1,532,000

-2%

City of Delta

$978,000

$1,003,000

+3%

Township of Langley

$920,000

$972,000

+6%

City of Langley

$803,000

$862,000

+7%

City of Abbotsford

$693,000

$758,000

+9%

City of Chilliwack

$559,000

$613,000

+10%

City of Maple Ridge

$757,000

$820,000

+8%

City of Pitt Meadows

$804,000

$871,000

+8%

District of Mission

$633,000

$698,000

+10%

District of Kent

$441,000

$512,000

+16%

District of Hope

$356,000

$416,000

+17%

Harrison Hot Springs

$539,000

$609,000

+13%

Market trends for strata residential properties (e.g. condominiums) by geographic area for select urban areas:

Community

2018 Average

Assessed Value

as of July 1, 2017

2019 Average

Assessed Value

as of July 1, 2018

% Change

City of Surrey

$458,000

$522,000

+14%

City of White Rock

$412,000

$479,000

+16%

City of Richmond

$598,000

$654,000

+9%

City of Delta

$529,000

$568,000

+7%

Township of Langley

$500,000

$561,000

+12%

City of Langley

$311,000

$396,000

+27%

City of Abbotsford

$275,000

$353,000

+28%

City of Maple Ridge

$394,000

$464,000

+18%

City of Chiliwack

$289,000

$355,000

+23%


Copyright © 2019 Key Media Pty Ltd

Clarity needed on possible change to rental bylaws

Thursday, January 3rd, 2019

Clarity needed on rental bylaws

Tony Gioventu
The Province

Dear Tony:

 Our strata is a 12-unit townhouse complex in Coquitlam built in 2002. We are deeply concerned by the government planning to remove rental restriction bylaws from condos in B.C.

We permit two rentals and the two rentals have been nothing but a source of chronic problems for our volunteer council. Hiring a management company to deal with the ongoing issues is simply too expensive for a small strata corporation and with the elimination of rental bylaws, we will simply be left with more tenants and a smaller group of owners left to self-manage our corporation.

So, because the government has not planned for housing expectations and local governments have allowed developers to run rampant on development with no rental commitments, the government has decided to download the problem to the consumers who form the backbone of our economy.

Even though we are small, we still have the same duties and liabilities as a 200-unit strata council a block away, but we will not have the financial resources to fight the constant tenant battles that arise.

There is nothing in the legislation that compels a landlord to participate in the operation of a strata corporation, and the removal of a tenant or the enforcement of bylaws and tenancy laws is a joke.

We have discovered from the residential tenancy board that as a council, we do not have standing in the landlord and tenant relationship as we are not part of that agreement and therefore cannot evict the tenant. Considering we are, and have always been a 100-per-cent occupied property, how does eliminating rental bylaws solve a housing problem?

Karen M.

Dear Karen: 

The government has not yet made any decision on whether to repeal or amend the legislation that would change rental bylaws for strata corporations.

The task force that was struck by government has recommended the repeal of rental bylaws; however, in spite of the detailed research and opposition provided, chose to proceed on an independent agenda and not acknowledge the impact this will have on strata owners and residents in B.C. 

Under the Strata Property Act and the previous Condominium Act, strata corporations were permitted to adopt bylaws that either prohibited rentals or limited them to a specific number or percentage. In addition, family members who were the children or parents of the owner or the owner’s spouse were exempt, and owners who provided evidence of a reasonable hardship to their strata council were exempted. Prior to Jan. 1, 2010, the first owner was exempted by a developer rental exemption, and since Jan. 1, 2010 any strata lot that was identified as exempt by the owner developer was exempt for the period listed.

With few exceptions, every strata corporation since 2010 has been exempted from rental bylaws. As more than half of the strata corporations in B.C. are less than 50 units and over 90 per cent are self managed, it would be safe to assume that every volunteer strata council in those properties will be responsible to deal with the additional tenancy issues in the event rental restriction bylaws are removed.

In 2017, the CHOA conducted a direct building study of eight buildings that were exempted from rental bylaws since 2010 and eight comparable buildings that were developed prior to 2010. The eight buildings constructed since 2010 have no rental bylaws and have a vacancy rate averaging 30 per cent, with the majority of the unoccupied units being used by investors or for short-term vacation rentals.

Clearly, rental plays no role in the matter of occupancy in these buildings, largely due to the value of these units and the cost to make rentals feasible. In the eight buildings that were constructed prior to 2010, most with rental bylaw limits, not restrictions, the vacancy rate is below two per cent, most of which was accounted for by transitional ownership. This is consistent across the province.

How would removing rental bylaws increase rental inventory in an already extremely low vacancy? Before the government makes a decision on terminating rental bylaws, it is essential it provides assurances to the public how the removal of rental bylaws will affect occupancy, provide more rental housing, and the change in legislation will not create an operational nightmare for smaller strata corporations.

There is no evidence that indicates rental bylaws reduce rental housing availability to the public when the properties with rental bylaws already have the lowest vacancy rates in the province. The changes to the legislation will have a dramatic affect on property use, open all properties to speculators, investors and developers, especially in retirement communities that are also vacation resorts, affecting senior communities contrary to the government policy of keeping seniors in their own housing as long as possible.

The argument that other provinces do not permit rental restrictions is not based on comparable legislation. No other province permits the strata titling of duplexes and small townhouse units, compelling owners to collectively manage all property.

B.C. has over 30,000 strata corporations; over 22,000 of them will be affected by this change in legislation. It is important to voice your opinion as an owner, investor and strata council member. Contact your local MLA and the minister responsible for the Strata Property Act: Selina Robinson, minister of Municipal Affairs and Housing. ([email protected])

© 2019 Postmedia Network Inc.

B.C.’s five most expensive neighbourhoods

Thursday, January 3rd, 2019

Most valuable homes in province are in Kitsilano, Point Grey and Shaughnessy

David Carrigg
The Province

Chip Wilson?s Kitsilano house is a grey concrete structure with an assessed value of $73.12 million, the most expensive home in the province, according to the B.C. Assessment Authority. It?s listed at 15,694 square feet, with the basement boasting the most square footage. MARK VAN MANEN

Point Grey

Shaughnessy

Coal Harbour

Southlands

A search through the B.C. Assessment Authority’s list of the most valuable homes in B.C. is dominated, naturally, by the City of Vancouver.

Kitsilano

  • At the top of the pile is Chip Wilson’s Kitsilano manse. The $73.12 million grey concrete structure was built across four waterfront lots in 2008 and is listed at 15,694 square feet (curiously, the most spacious of the three floors is in the basement — a.k.a. a monstrous flat screen and a big, big gym). The address is 3085 Point Grey Road if you want to take a stroll along the mostly car-free stretch in front of the home and have a looky loo.

Breaking it down by Vancouver neighbourhood, that puts Kitsilano at the top.

Point Grey

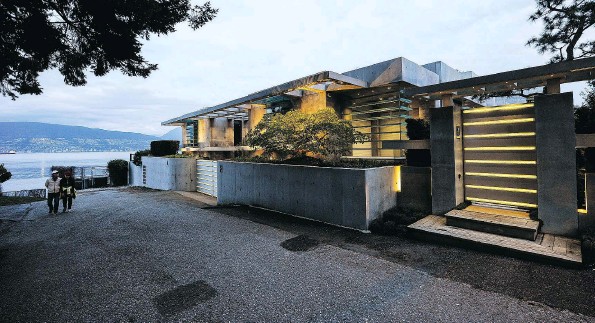
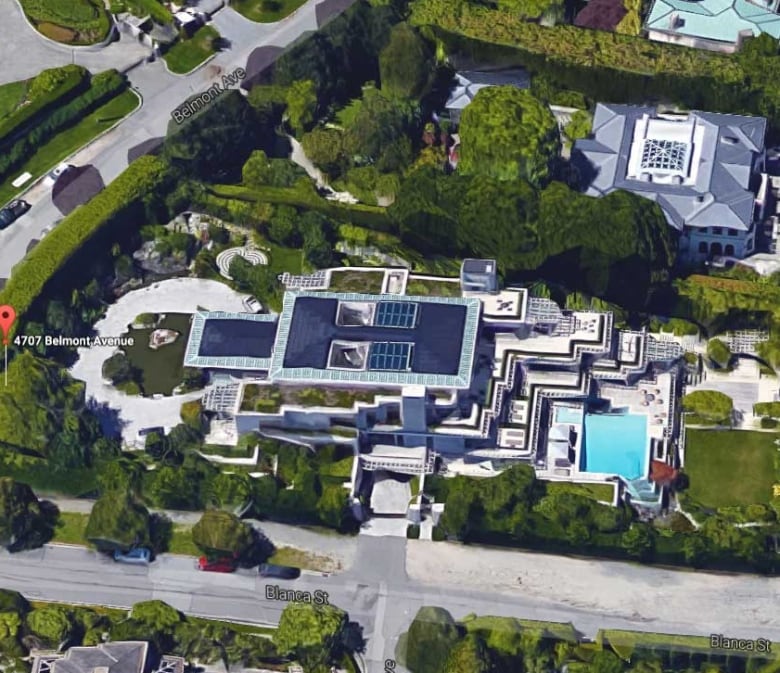
  • At No. 2 is Point Grey, where a home at 4707 Belmont Avenue was valued at $65.47 million, as of July 1, 2018, which is the valuation date the assessment authority uses. For my money, this is better value than Chip’s place. Completed in 2007, it’s on a massive 1.719 acre lot with the same ocean views and has 28,794 square feet of living space, with most of that on the top floor, not in the basement.

Shaughnessy

  • Vancouver’s third priciest neighbourhood is Shaughnessy, which has as its most valuable residence a $35.16 million, 17,000 square foot home completed in 1998 that boasts an indoor pool, underground parking and a 2,000 square foot maid’s residence. The address is 3489 Osler Street.

Coal Harbour

  • The fourth most valuable neighbourhood, according to the assessment authority list, is Coal Harbour which has as its most valuable residence a condo — a really, really expensive condo. This place is listed as Unit 3101-277 Thurlow Street and is valued at $32.34 million. It’s on the top floor and comprises 8,000 square feet. Strangely, it has six bathrooms and three bedrooms. What choices. This property was sold to 0996109 B.C. Ltd. in May 2014 for $16,600,000. A cash sale. According to title records, the key company director is Wang An Ban.

Southlands

  • The fifth most valuable neighbourhood is Southlands, in southwest Vancouver. The property of greatest value there is at 2106 Marine Drive and is worth — according to the authority — $22.19 million. Most of the value is in the land, as the 10,000 square foot home sits on a 4.2 acre site. The home was built in 1929. It’s owned by 2106 Marine Holdings Ltd., a company whose main director is Tsai Pei-Ching of Taiwan.

© 2019 Postmedia Network Inc.