Stephanie Armour
USA Today

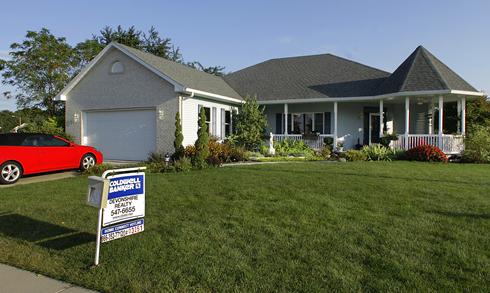
A home for sale in Springfield, Ill., Monday, Aug. 23, 2010 By Seth Perlman, AP
Home sales plunged in July to record lows as buyer demand withered after the expiration of a federal home buyer tax credit — a drop that shows troublesome weakening in the housing market recovery.
Sales of existing homes tumbled 27.2% in July to a seasonally adjusted annual rate of 3.83 million units from 5.26 million in June, according to a report Tuesday by the National Association of Realtors. Sales are at the lowest level since the report began being released in 1999, and sales of single-family homes — which account for the bulk of transactions — are at the lowest level since May 1995.
“This qualifies as a double dip in housing,” says Mark Zandi, with Moody’s Analytics.com. “It’s particularly disconcerting given that fixed mortgage rates are lower. The recovery is weakening. These are pretty ugly numbers.”
Economic fundamentals aren’t working to buoy the housing market, economists say, and the real engine that is needed to turn the recovery around is more private sector jobs.
“Jobs, jobs, jobs,” says Robert Dye, senior economist with PNC Financial Services Group, adding that government stimulus efforts such as another tax credit are unlikely to create lasting benefits. “Another tax credit will pull demand forward and then a hollowing out (of sales) again.”
Economists say they were surprised by the size of July’s drop in home sales, which indicates buyers have scant confidence in the housing market. Existing-home sales fell 35% in the Midwest in July, 29.5% in the Northeast; in the West, they fell 25% and they were down 22.6% in the South.
“This is extraordinary, how low the demand is, “ says Joel Naroff, of Naroff Economic Advisors. “The (housing) sector is still flat on it’s back.”
The number of homes on the market also grew, which tends to dampen prices. Housing inventory at the end of July increased 2.5% to 3.98 million existing homes available for sale, a 12.5-month supply at the current sales pace, up from an 8.9-month supply in June. A six-month supply is considered normal.
One reason the market is hurting is that buyers and sellers are in a standoff over prices. Many sellers are reluctant to lower their prices. And buyers are hesitating because they think home prices haven’t bottomed out.
“It really is a self-fulfilling prophecy,” said Aaron Zapata, a real estate agent in Brea, California. “If all buyers perceive that home prices are coming down, then they will stop making offers — and home prices will come down.”
Some economists say any turnaround in the housing market is going to take time. Sales are expected to perk up in October and November, but even then, so many homeowners have so little equity in their homes that many can’t afford to buy a new home.
“Even if you have 10% (equity) left in your house, you don’t have enough to get you to another house unless you downsize dramatically,” Naroff says.
The median sale price was $182,600, up 0.7% from a year ago, but down 0.2% from June.
Prices and sales in major metropolitan areas
|
Metro area |
Median Price |
Change from 1 yr ago |
||
|
|
||||
|
|
July ’09 |
Jul ’10 |
Price |
Sales |
|
|
||||
|
Atlanta |
$132,800 |
$117,700 |
-11.4% |
-17.4% |
|
|
||||
|
Baltimore |
$268,800 |
$265,200 |
-1.3% |
-17.9% |
|
|
||||
|
Boston |
$358,100 |
$385,200 |
7.6% |
-26.3% |
|
|
||||
|
Cincinnati |
$132,600 |
$127,400 |
-3.9% |
-35.3% |
|
|
||||
|
Dallas-Ft. Worth |
$155,200 |
$155,300 |
0.1% |
-27.8% |
|
|
||||
|
Houston |
$163,900 |
$161,400 |
-1.5% |
-25.8% |
|
|
||||
|
Indianapolis |
$121,100 |
n/a |
n/a |
-15.0% |
|
|
||||
|
Kansas City |
$151,600 |
$142,400 |
-6.1% |
-38.4% |
|
|
||||
|
Miami-Ft. Lauderdale |
$214,600 |
$207,500 |
-3.3% |
-14.6% |
|
|
||||
|
Minneapolis-St. Paul |
$171,000 |
$175,000 |
2.3% |
-42.0% |
|
|
||||
|
New Orleans |
$172,900 |
$163,800 |
-5.3% |
-17.6% |
|
|
||||
|
New York-N. New Jersey-Long Island |
$394,800 |
$414,300 |
4.9% |
-24.9% |
|
|
||||
|
Philadelphia |
$244,200 |
$238,400 |
-2.4% |
-34.3% |
|
|
||||
|
Phoenix |
$137,700 |
$141,700 |
2.9% |
-25.5% |
|
|
||||
|
Pittsburgh |
$128,500 |
$130,300 |
1.4% |
-34.5% |
|
|
||||
|
Portland |
$246,000 |
$253,400 |
3.0% |
-28.1% |
|
|
||||
|
San Antonio |
$160,600 |
$161,600 |
0.6% |
-23.0% |
|
|
||||
|
San Diego |
$372,100 |
$389,400 |
4.6% |
-15.2% |
|
|
||||
|
St. Louis |
$143,400 |
$147,700 |
3.0% |
-36.1% |
|
|
||||
|
Washington, DC |
$337,700 |
$351,100 |
4.0% |
-18.4% |
|
|
||||
|
Source: National Association of Realtors |
||||
|
|
||||
Contributing: Associated Press

